JSNA – People – Indices of Deprivation 2025
Last Updated: January 2026
Indices of Deprivation 2025
The English Indices of Deprivation (IoD2025) were published by the Ministry for Housing, Communities and Local Government (MHCLG) on the 30th October 2025. The indices provide a set of relative measures of deprivation at the Lower Super Output Area (LSOA) level. LSOAs are small, statistical areas with an average population of approximately 1,600 residents as at the time of 2021 Census.
The IoD25 is made up of 7 standalone indexes which are combined and weighted together to form the Index of Multiple Deprivation (IMD) 2025 – the official overall measure of deprivation in England. This dataset replaces the 2019 Indices of Deprivation.
National datasets and reports
The Ministry for Housing, Communities and Local Government has published a range of resources related to the IoD2025 data:
- IoD2025 Statistical Release: introduces the indices and presents a national summary of key analytical insights.
- IoD2025 Frequently Asked Questions: includes helpful explanations on how the indices are created, and how they can be used.
- IoD2025 National Datasets: the full set of available IoD2025 data at the LSOA level and other are type summaries, including at the local authority level.
- Local Deprivation Explorer: allows users to look up deprivation data for their area, explore comparisons across England using an interactive map, and download data.
- IoD2025 Research Report: outlines the main IoD2025 results and provides guidance on how to use and interpret the datasets.
- IoD2025 Technical Report: presents the concepts and methodology underpinning the indices and the indicators that make up the indices.
- GLA IoD2025 exploratory analysis: a focused look at the IoD2025 results for London, including domain-specific maps and consideration of changes compared to IoD2019.
Barnet-focused analysis
English Indices of Deprivation 2025 Barnet briefing
The briefing below gives an overview of deprivation in Barnet according to the IoD2025. It explores how deprivation may have changed across Barnet since 2019, and how this compares to other boroughs across London.
Read the full briefing paper here:
Deprivation tool
You can explore Barnet Indices of Deprivation 2025 data via our interactive Deprivation Tool. This also presents a range of other measures of deprivation, including the Annual Index of Deprivation and the Ethnic Group Deprivation Index.
Barnet filtered datasets
These datasets have been filtered to only show data related to Barnet and can be downloaded below:
Barnet Indices of Deprivation maps
Below are a variety of maps that visualise the IoD2025 at the LSOA level in Barnet. To see a map in greater detail, please click on the map to enlarge it.
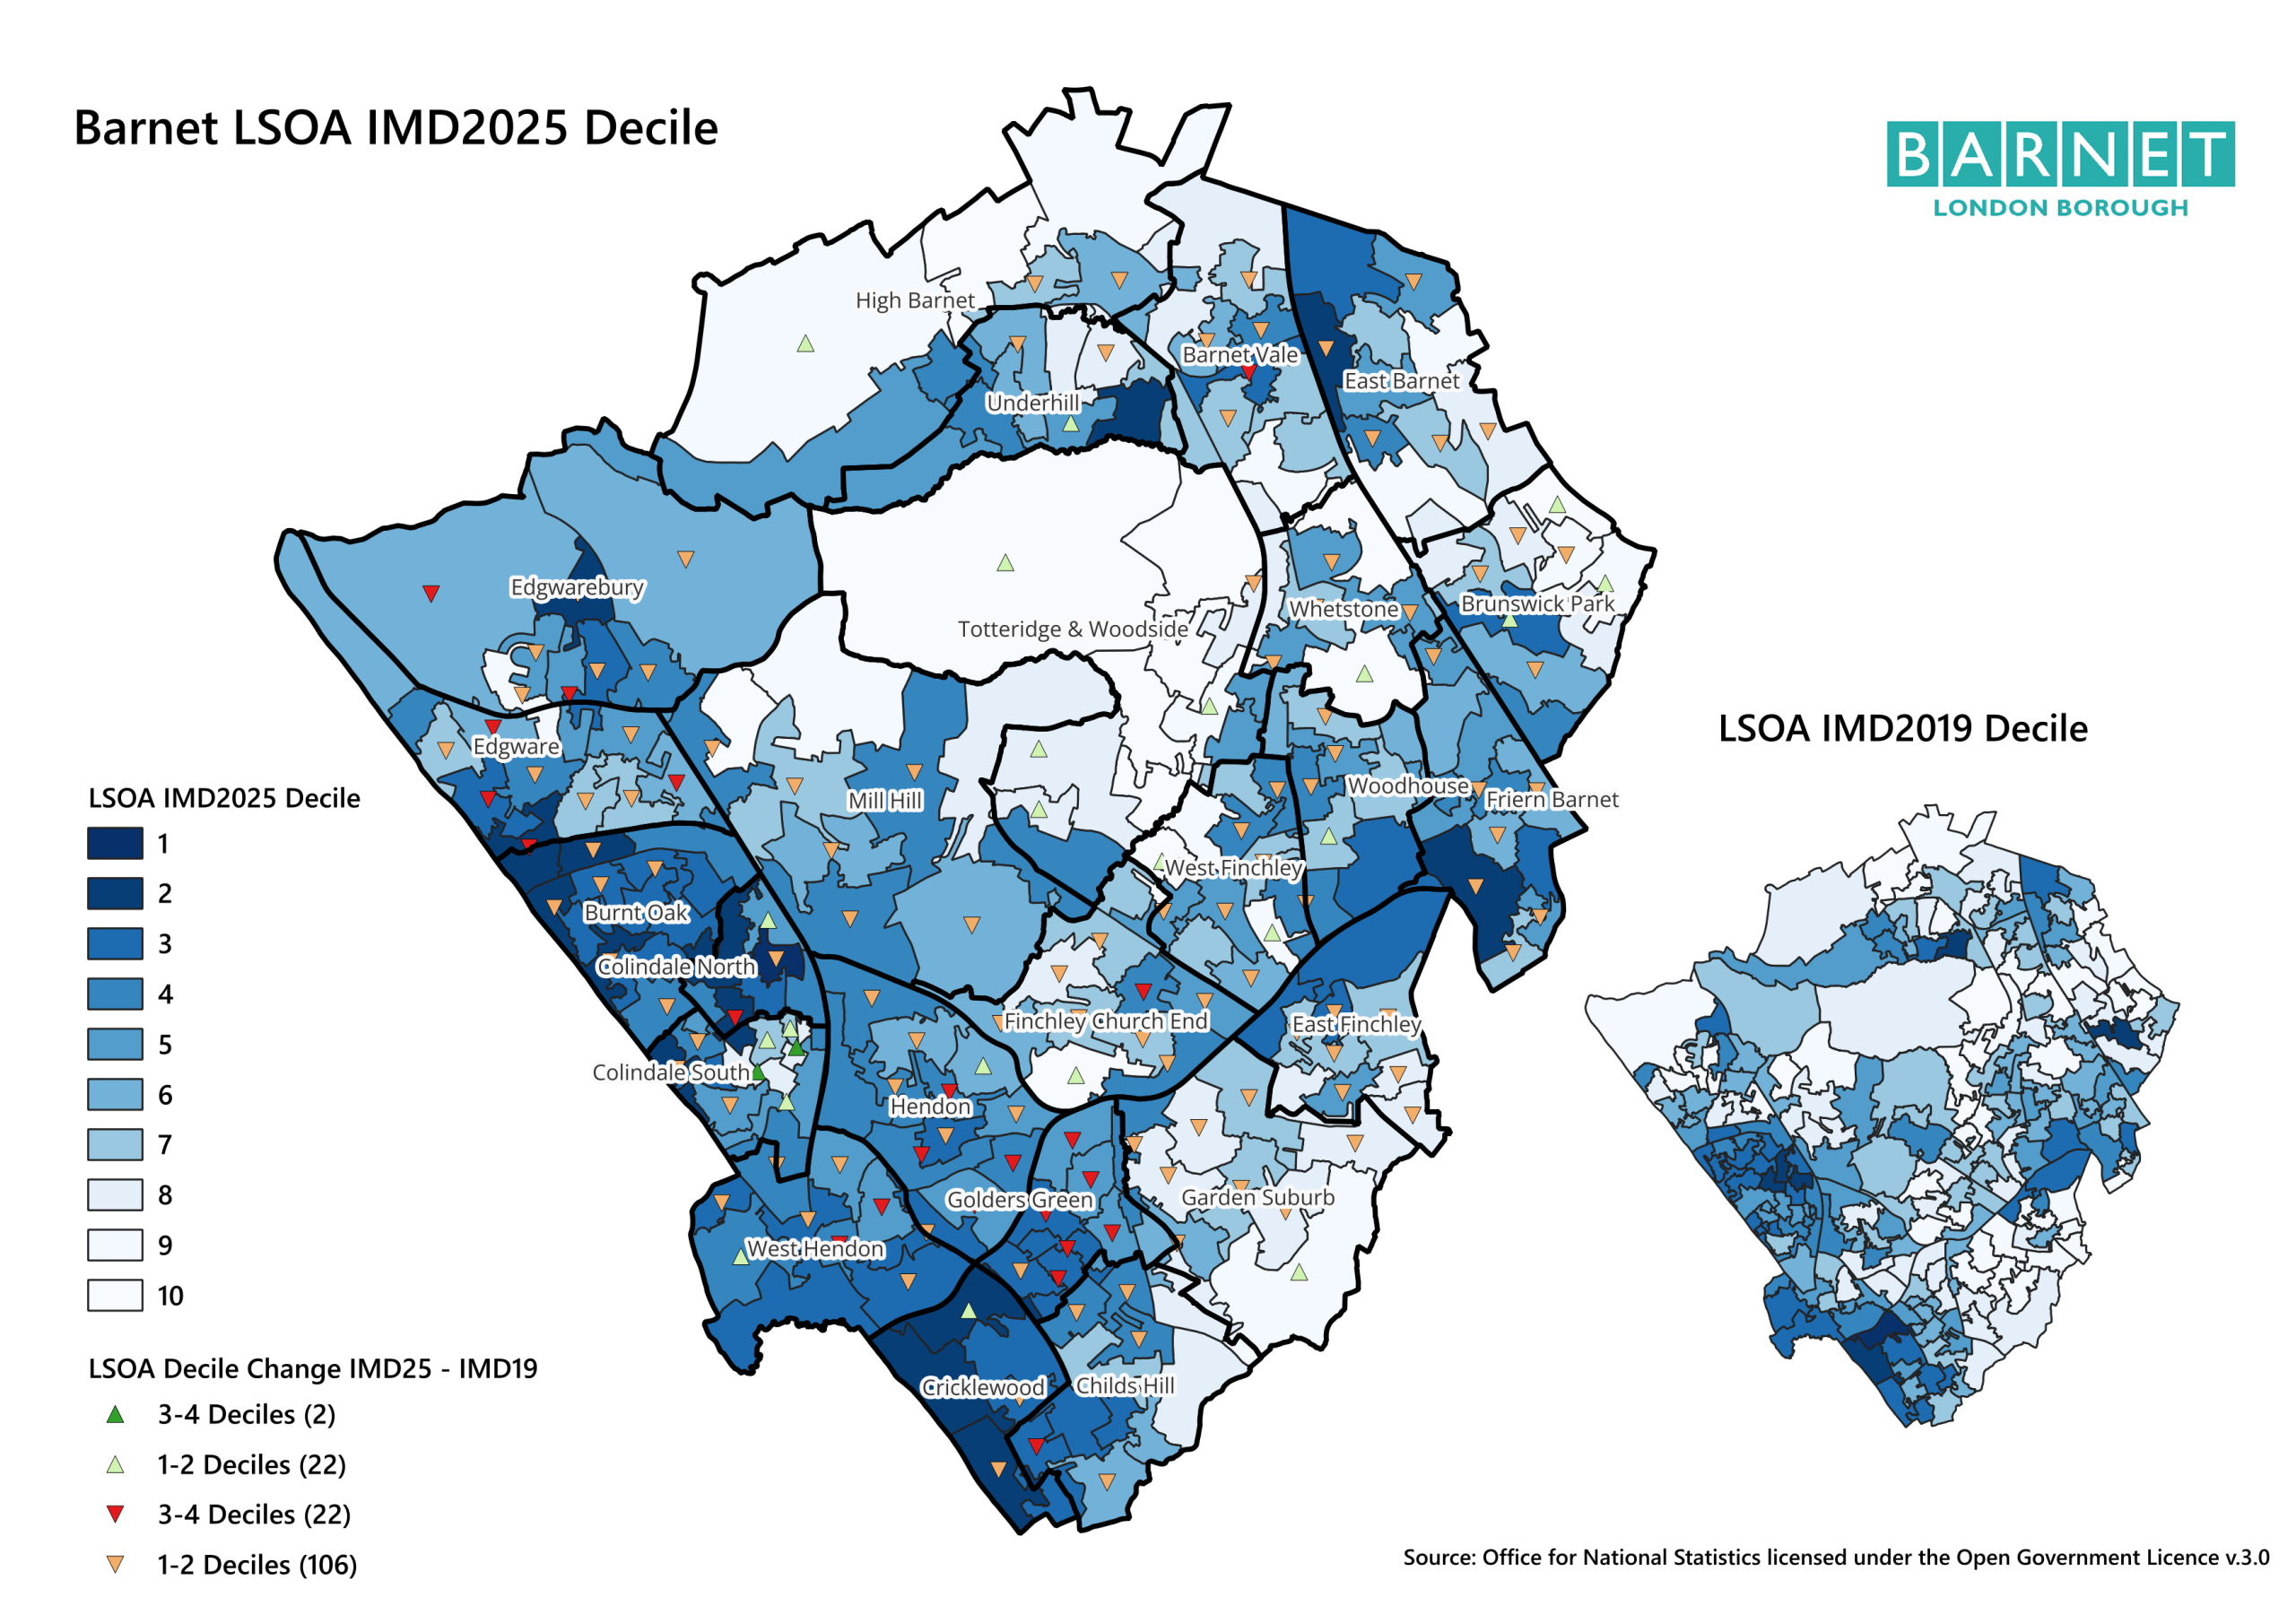
Maps showing the overall Index of Multiple Deprivation in 2025, and a comparison to the IMD 2019:
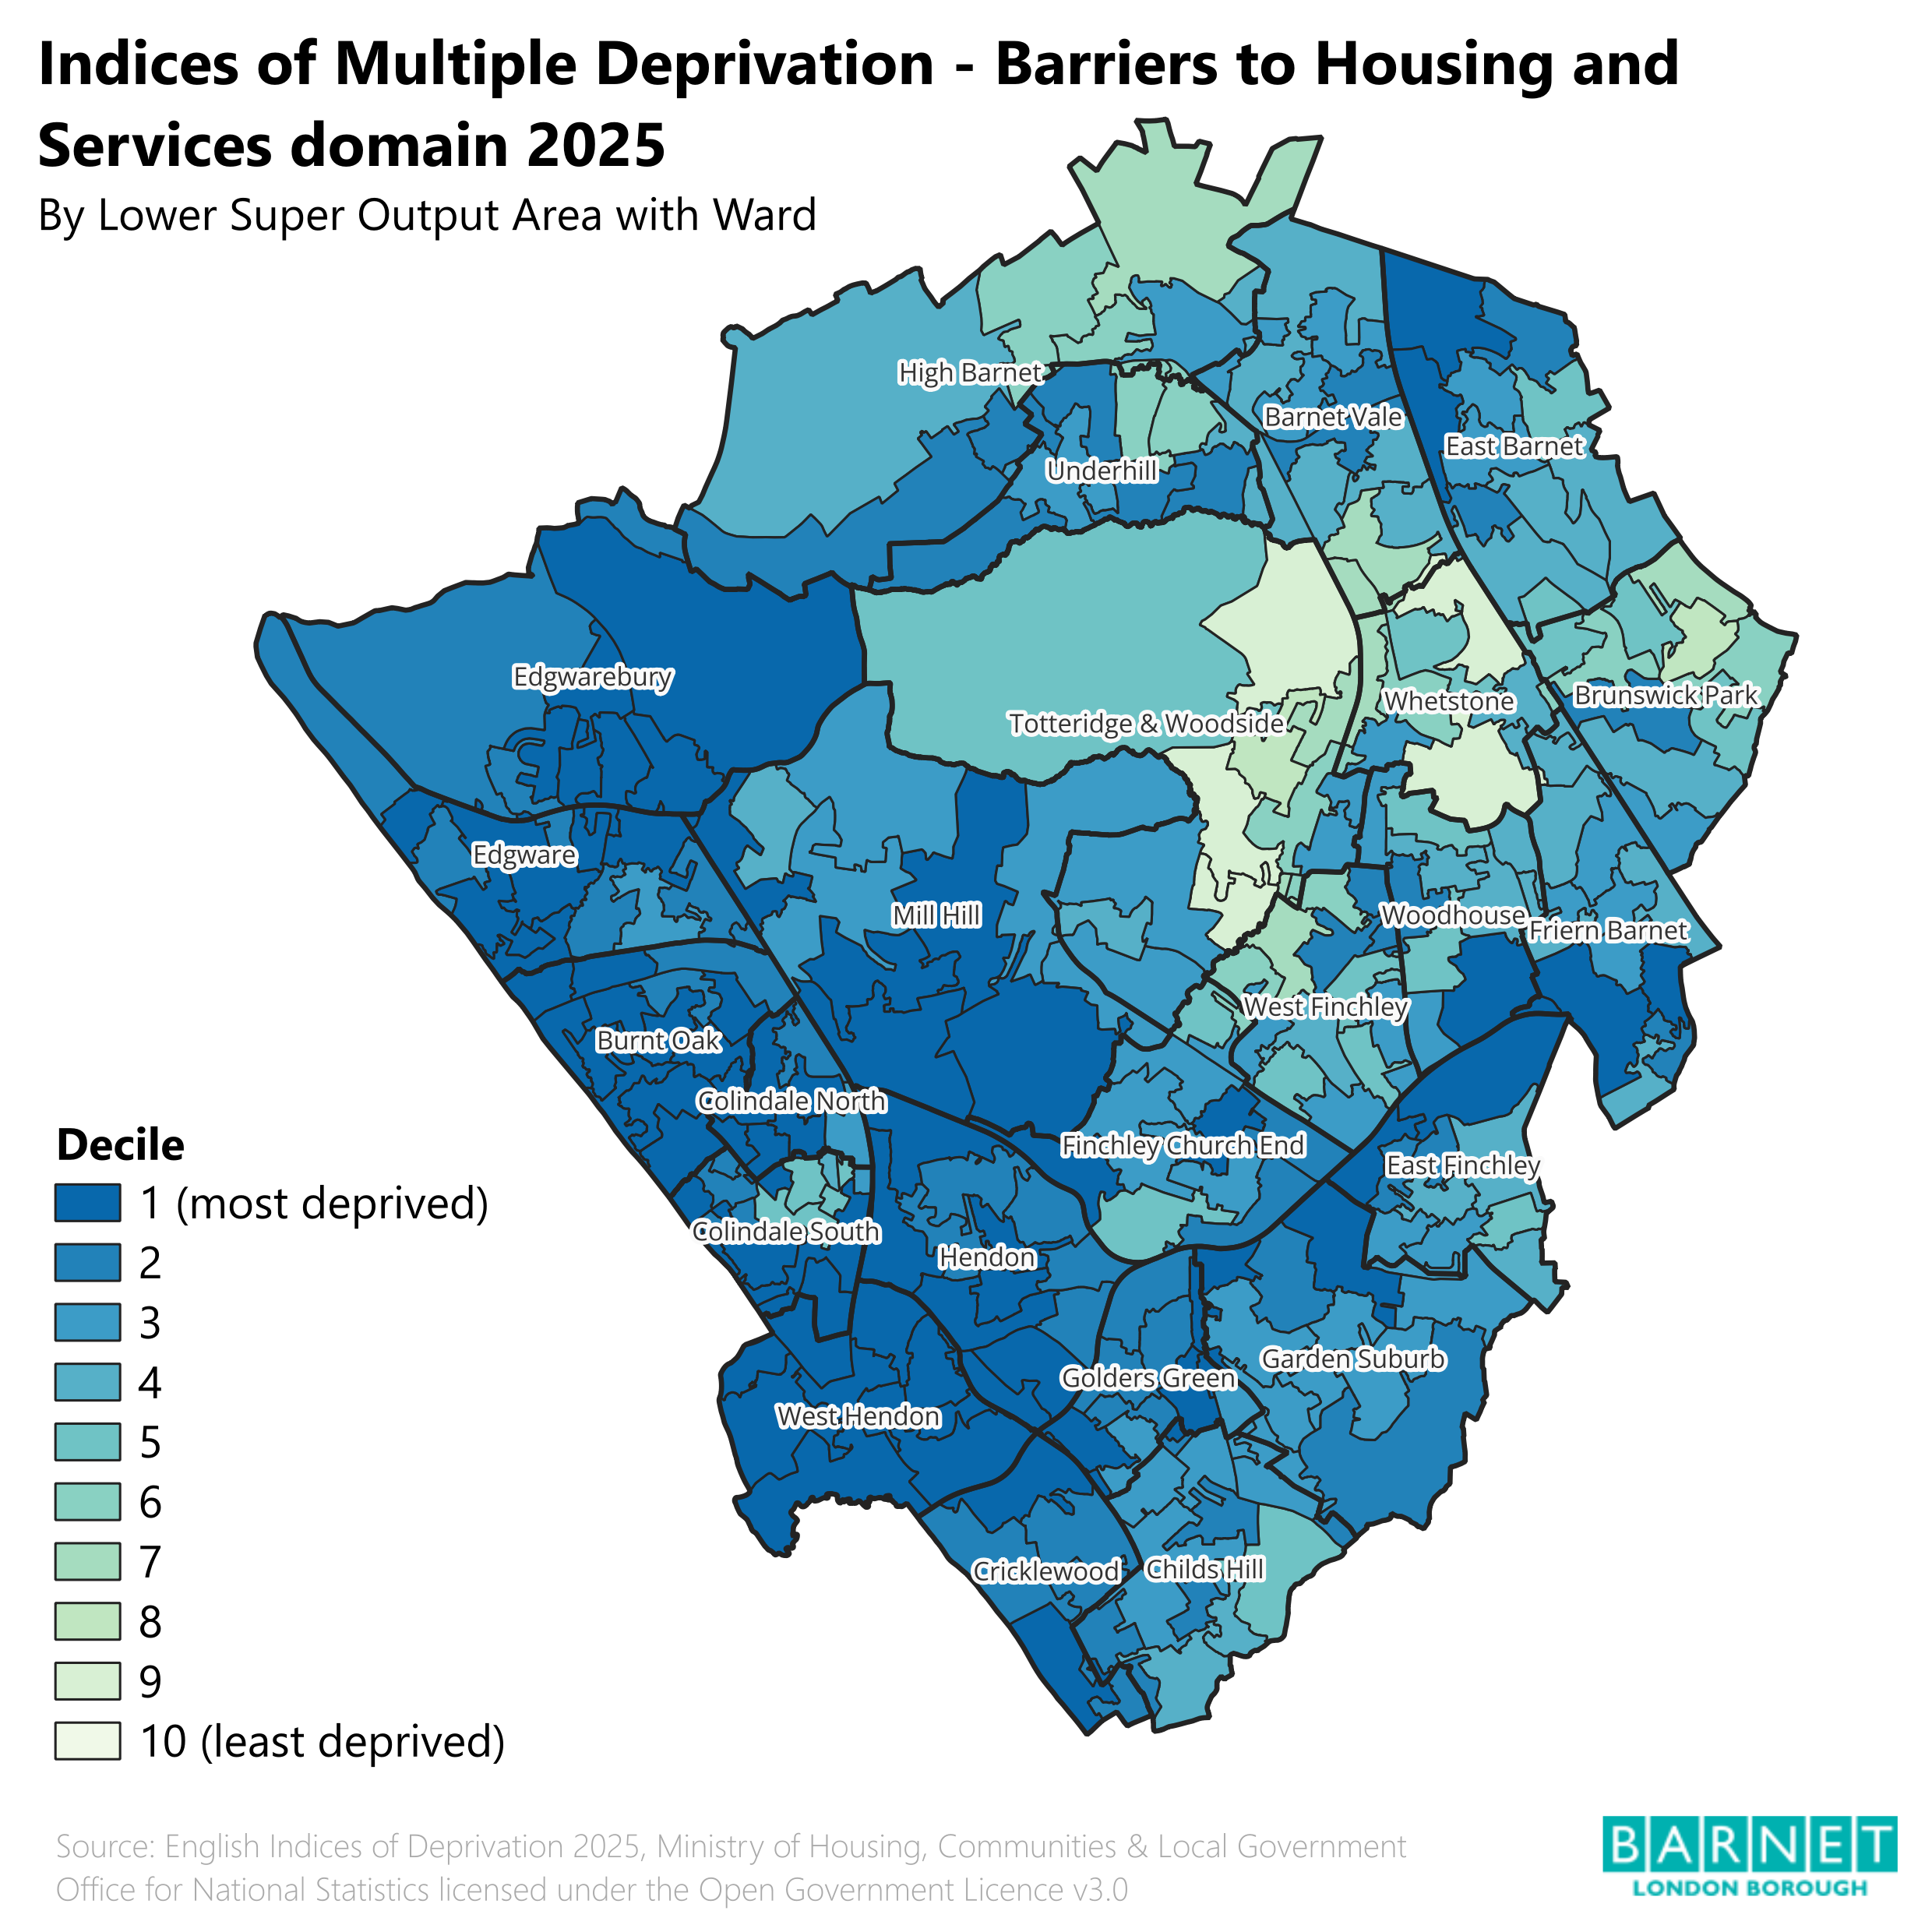
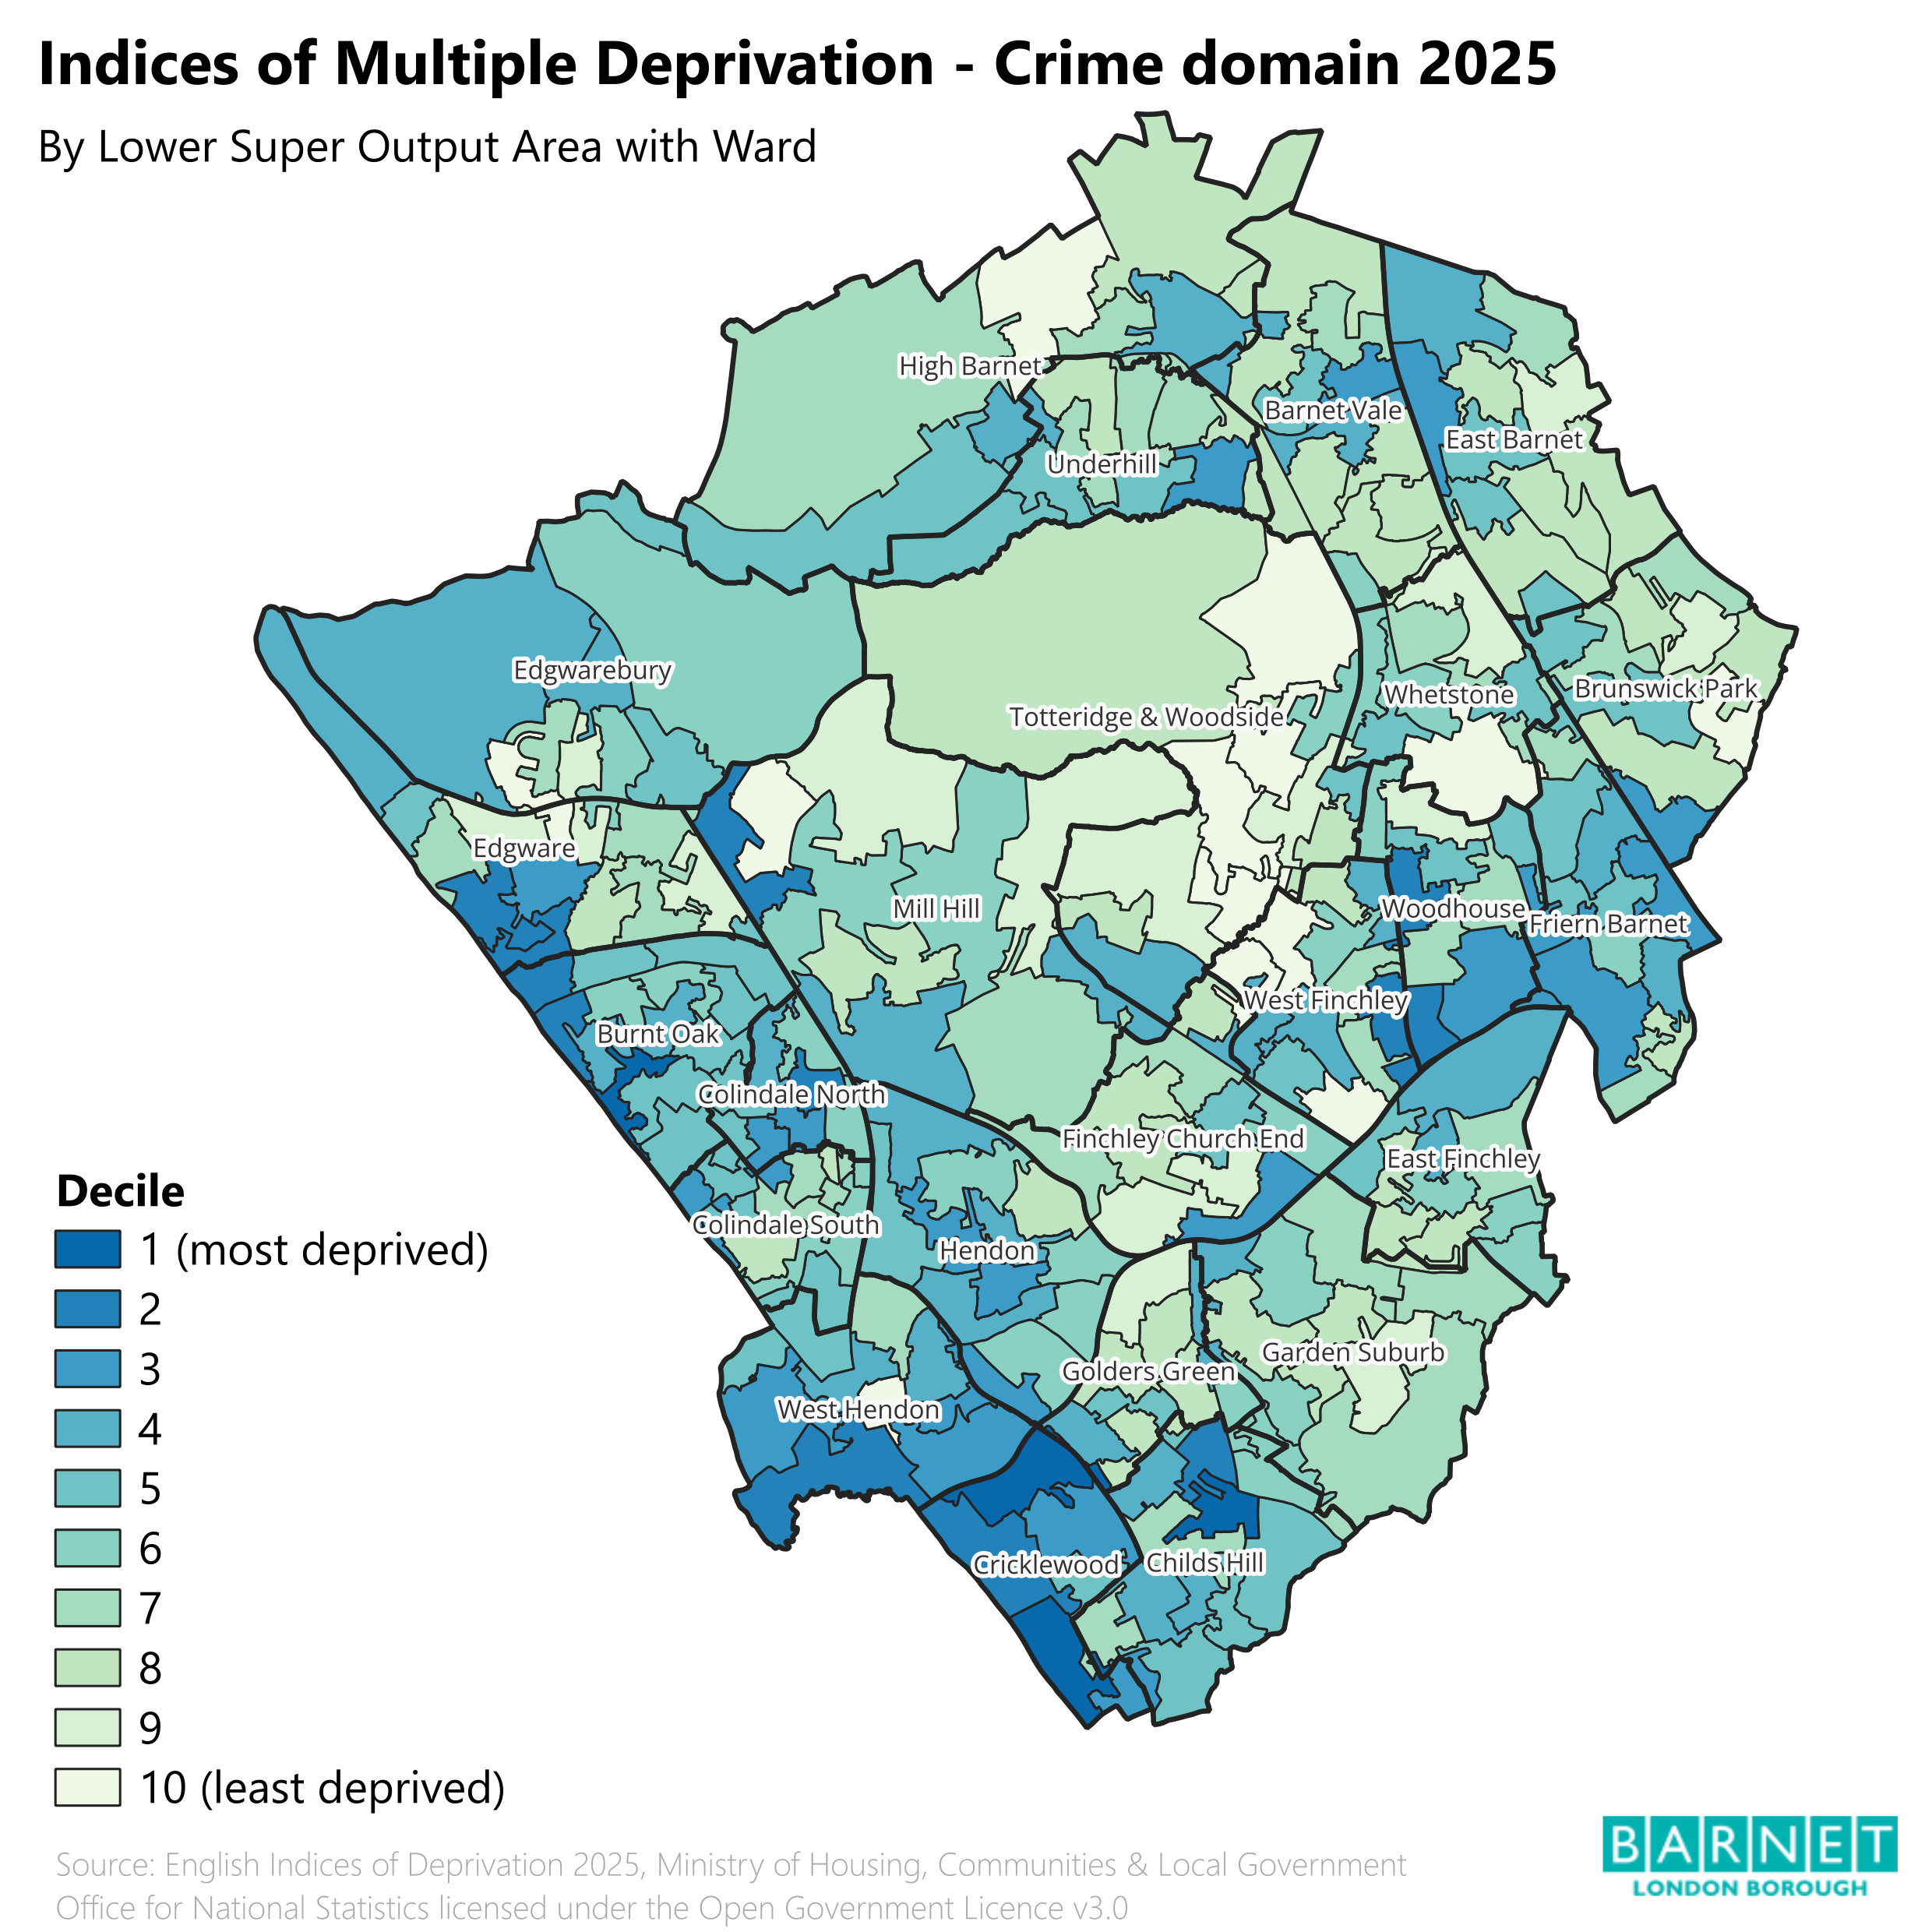
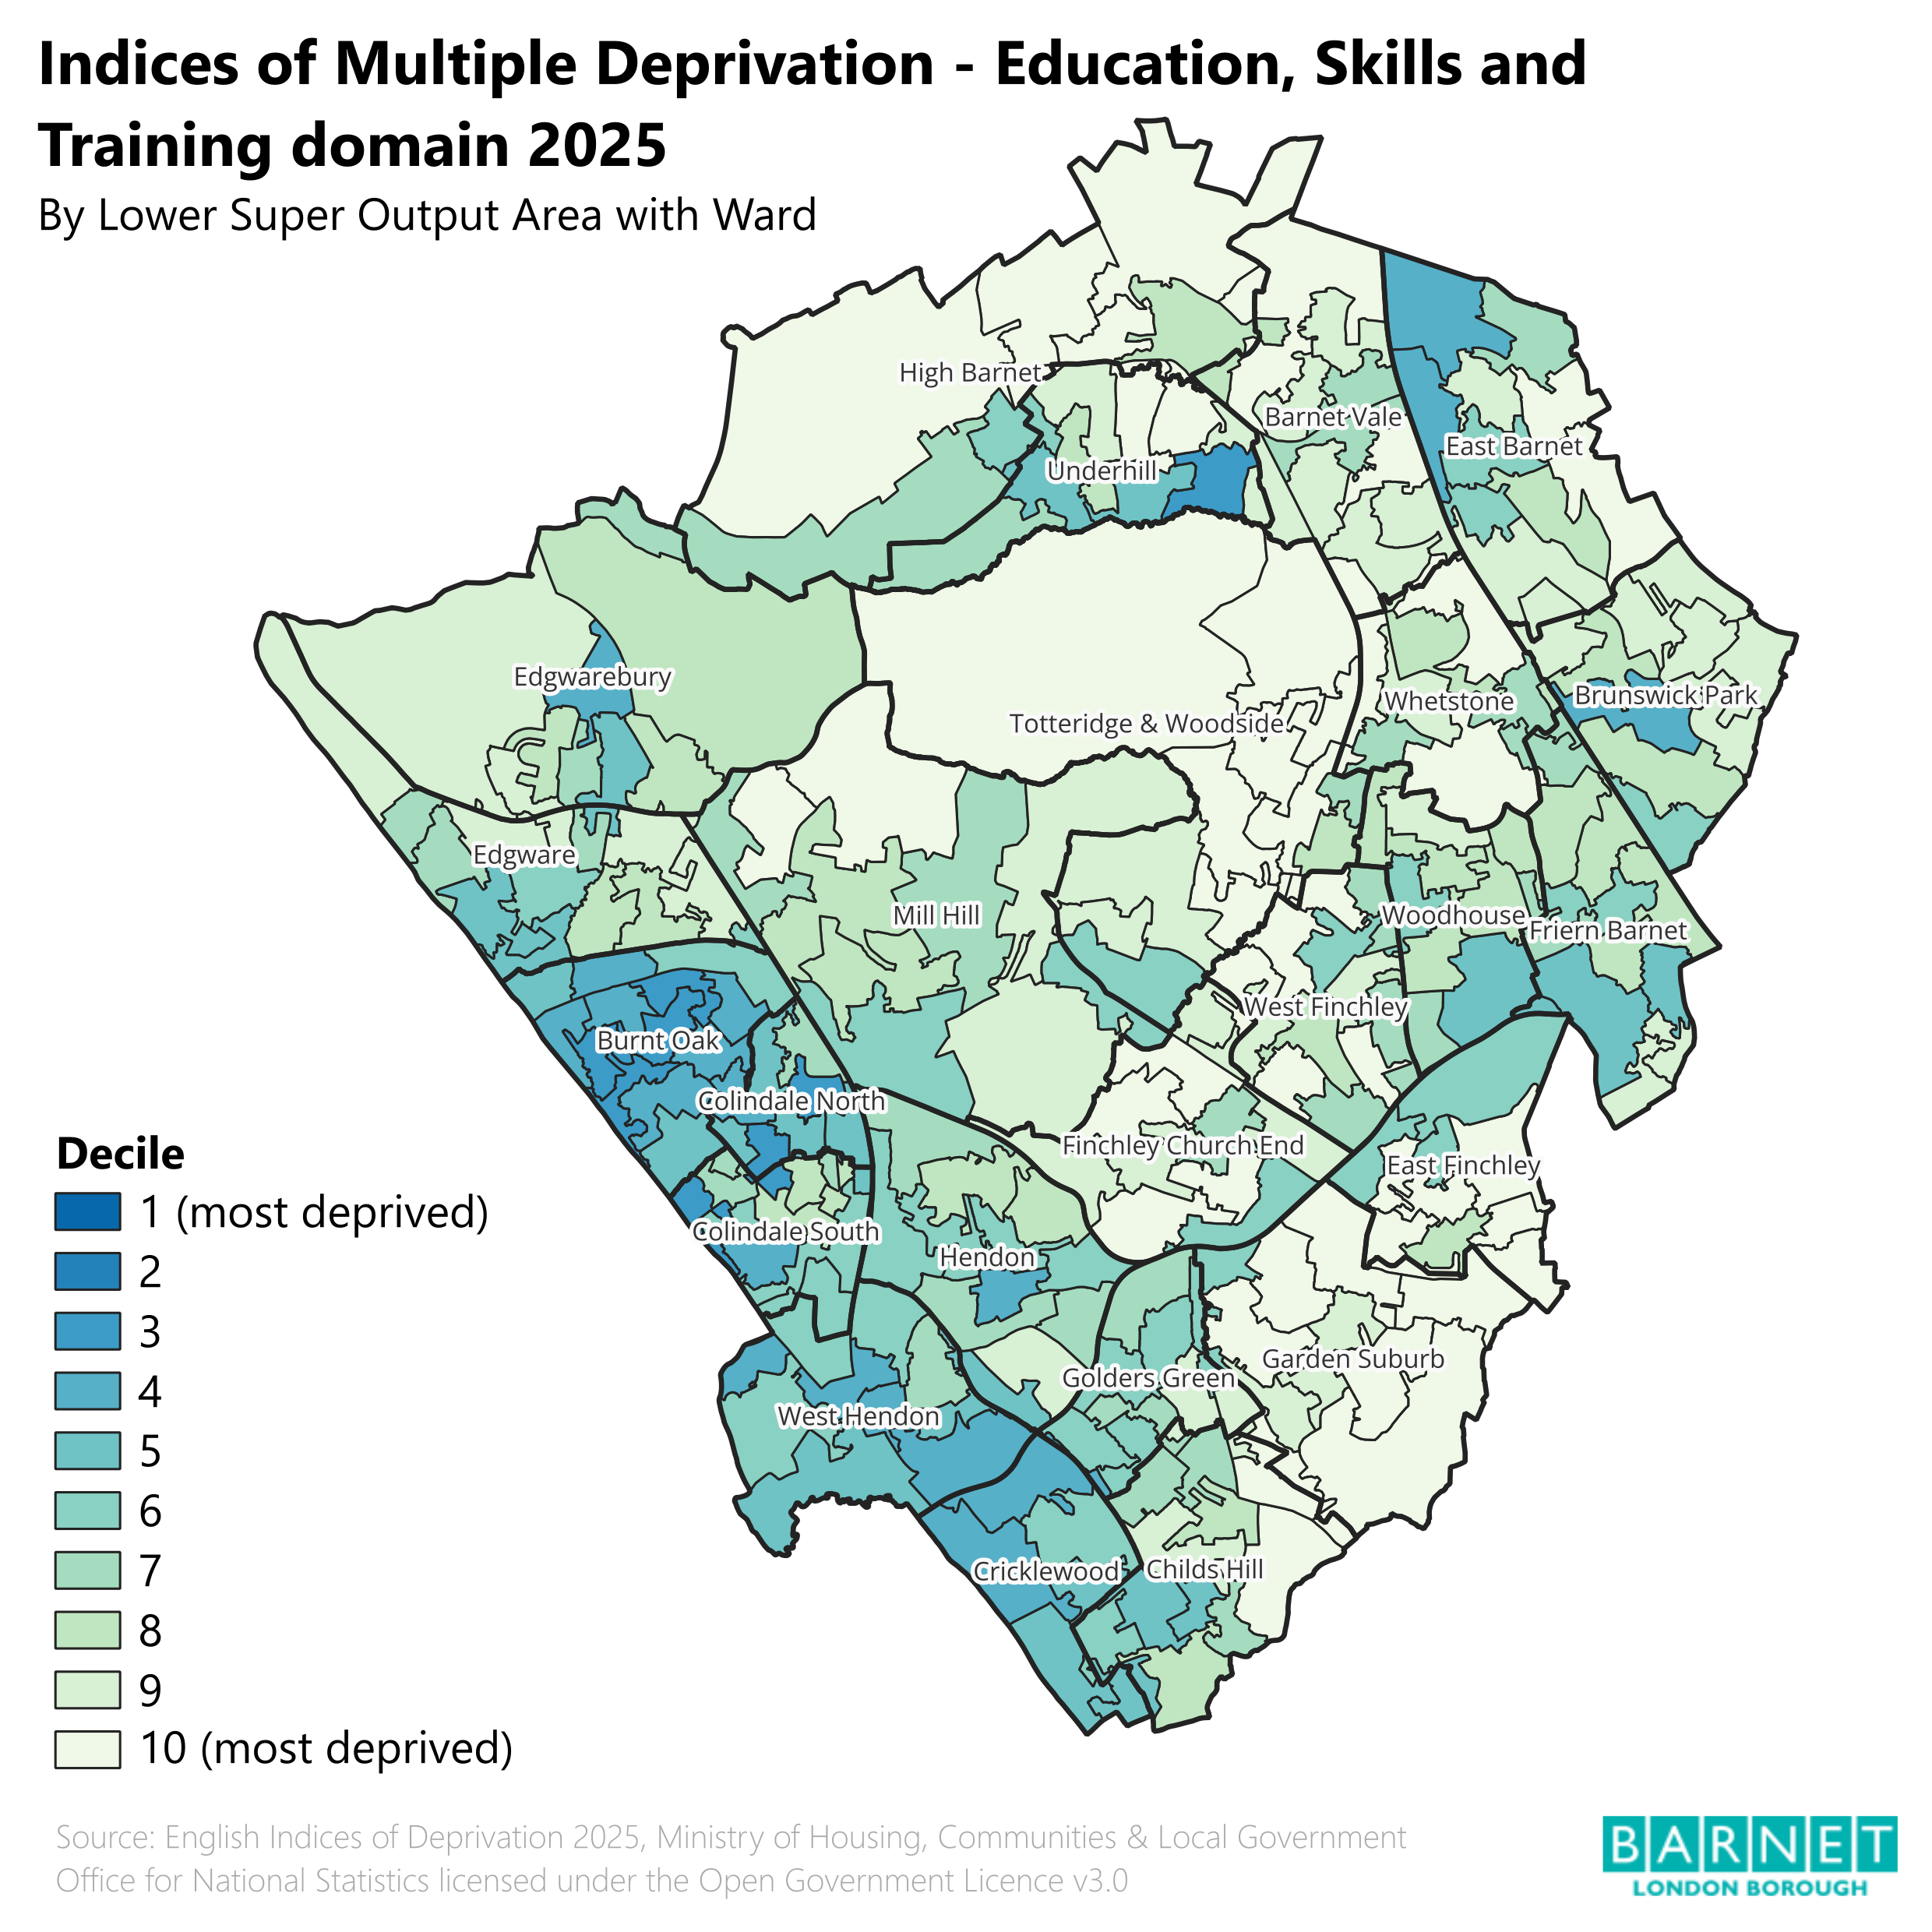
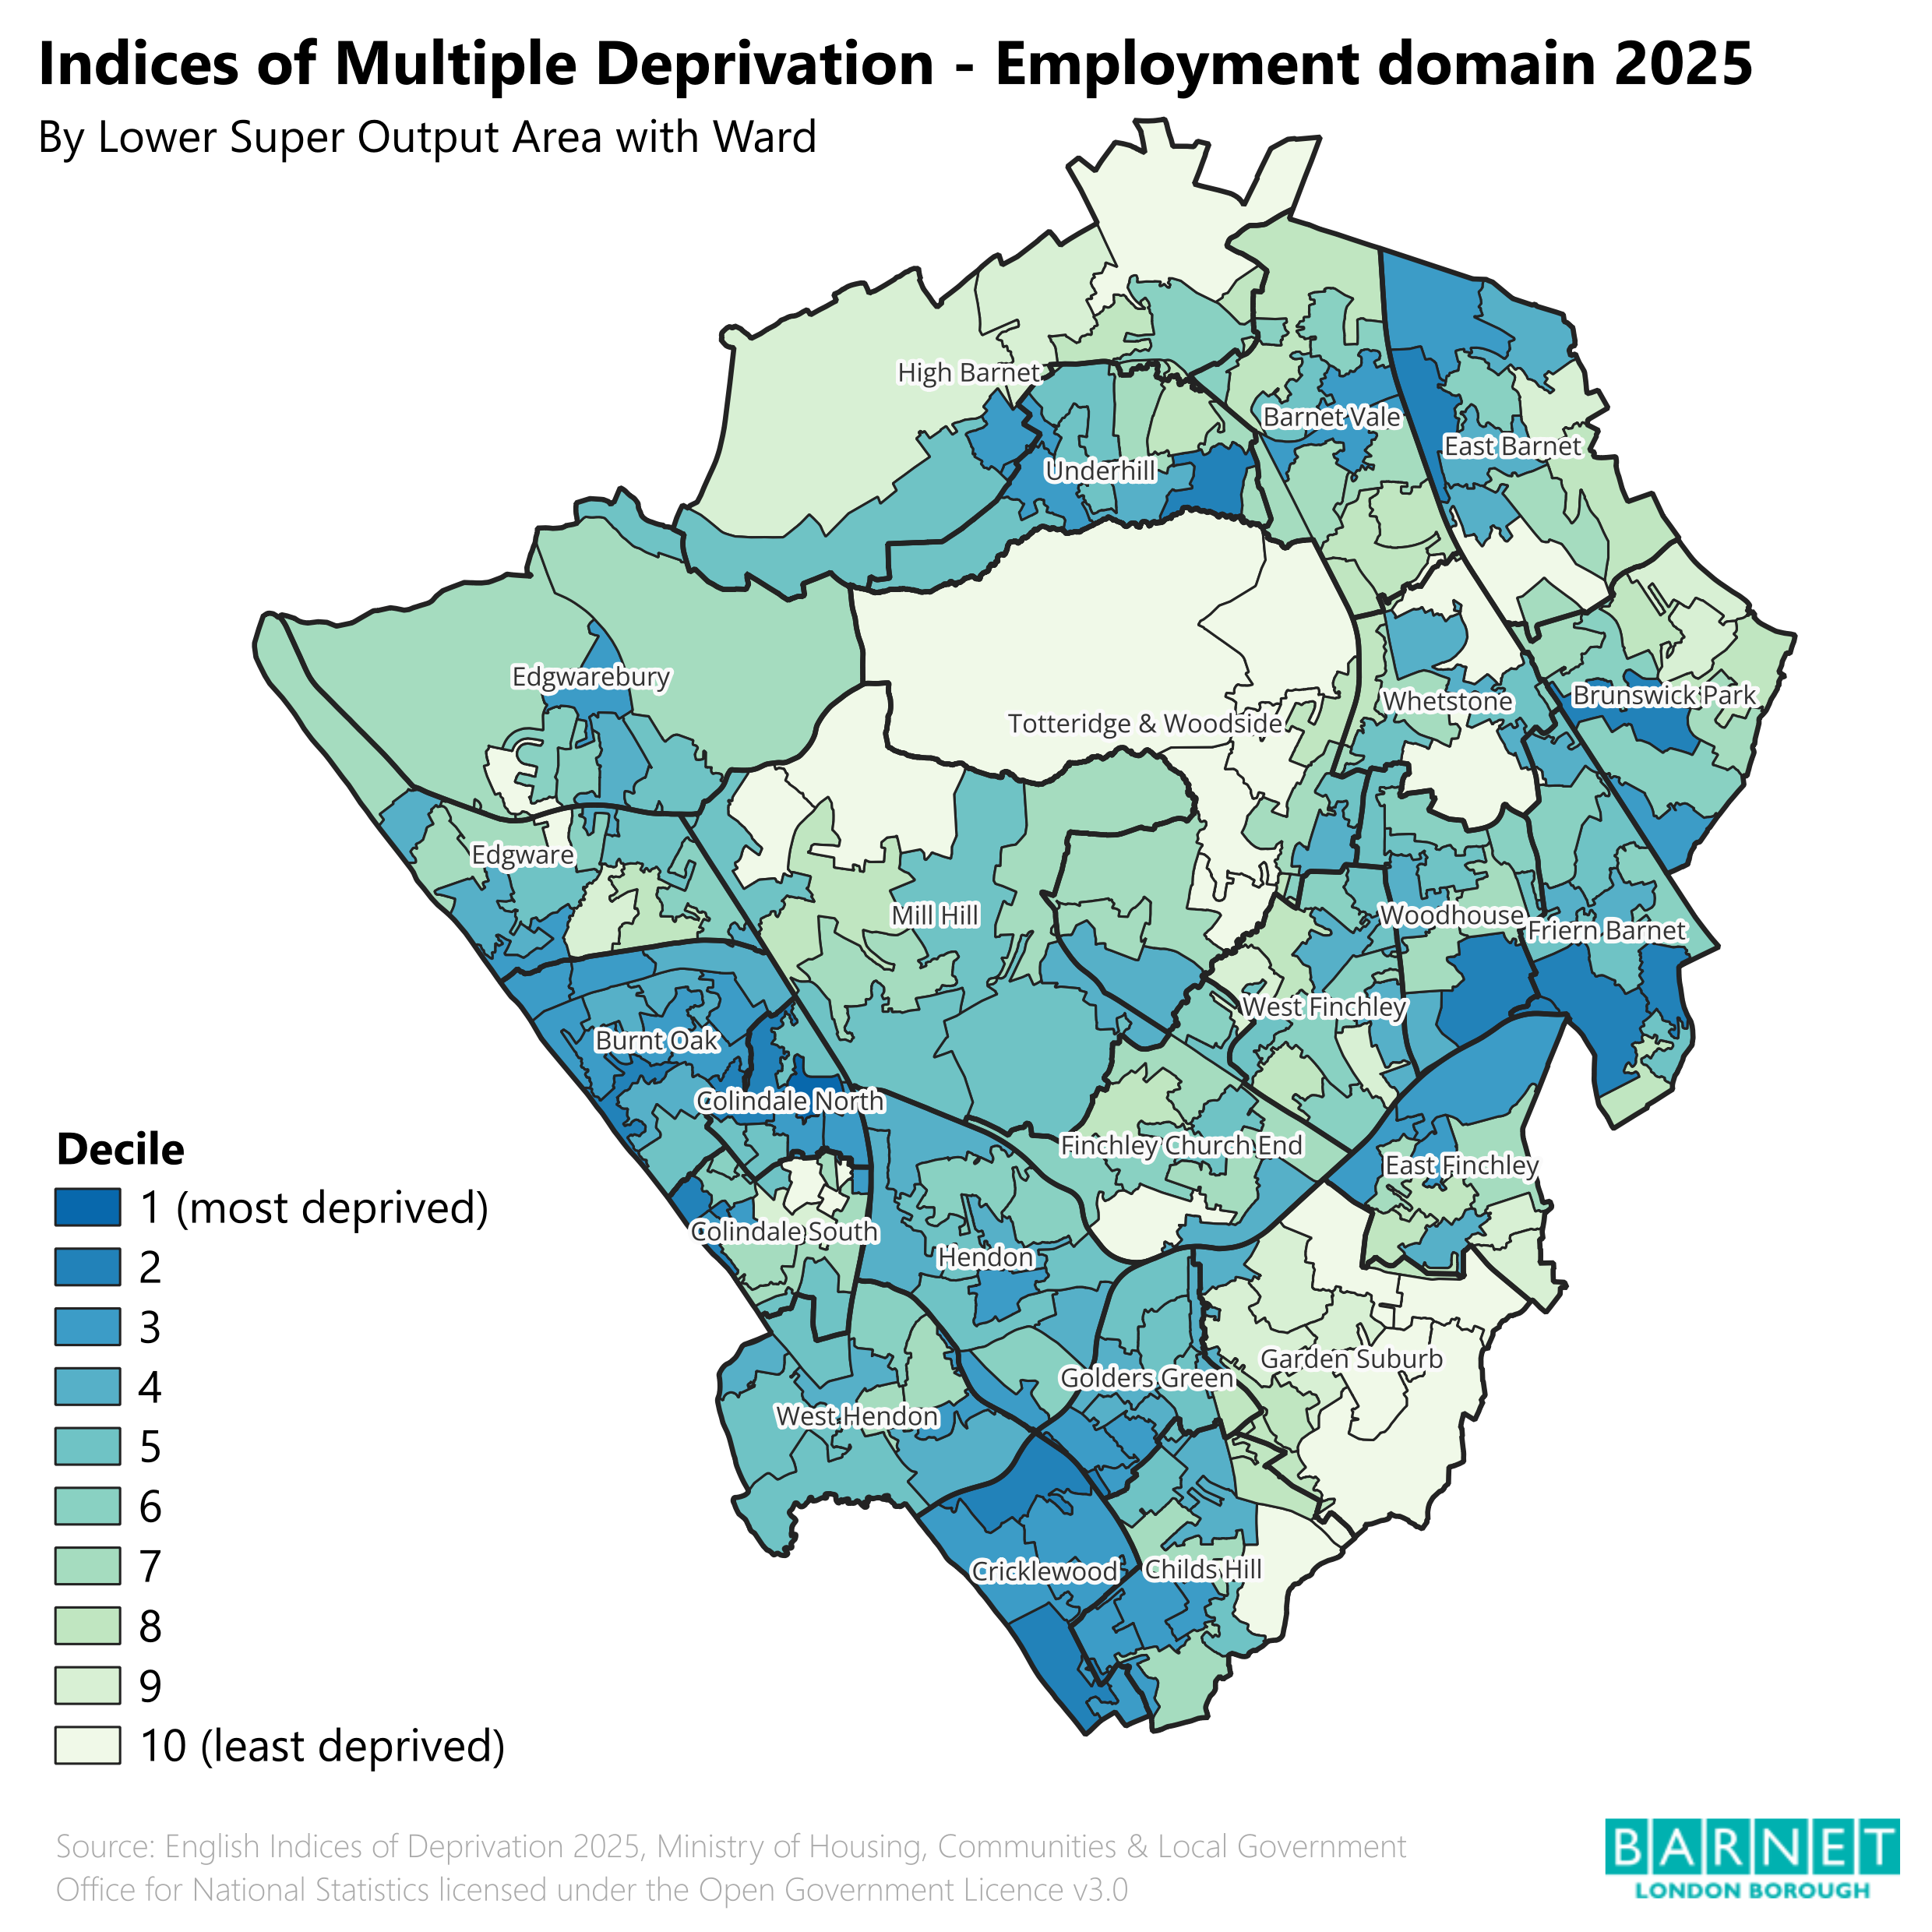
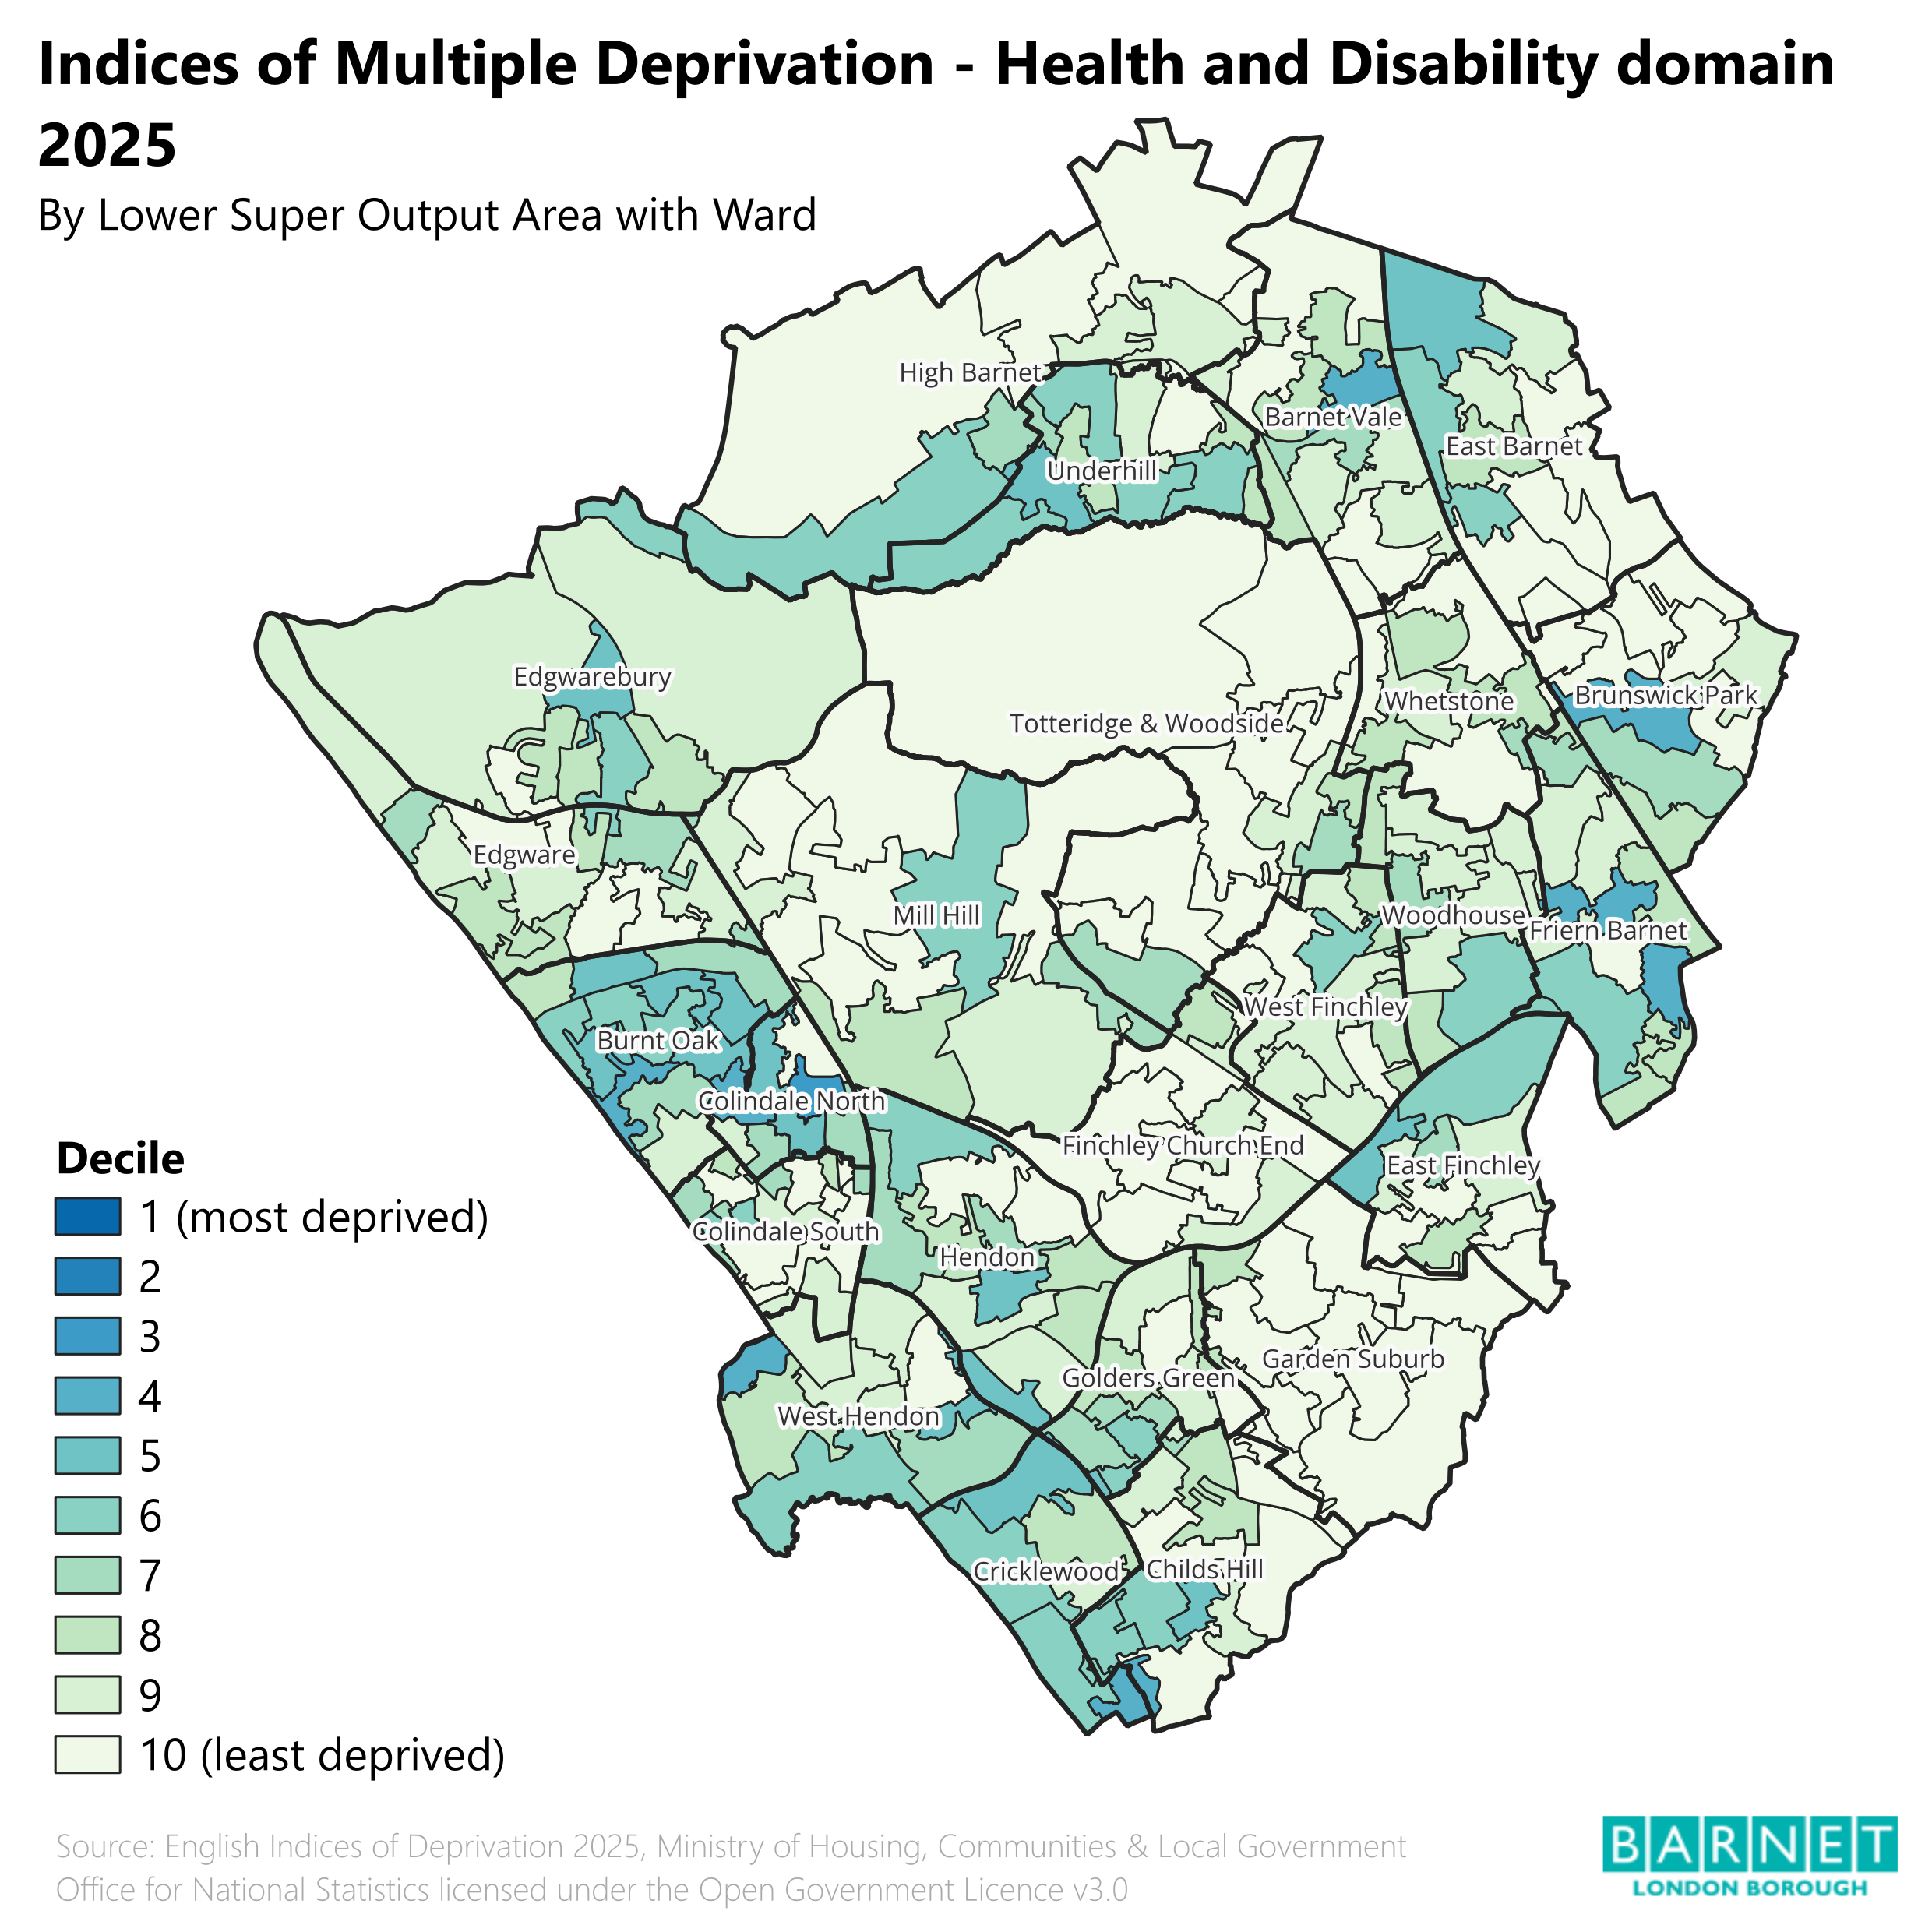
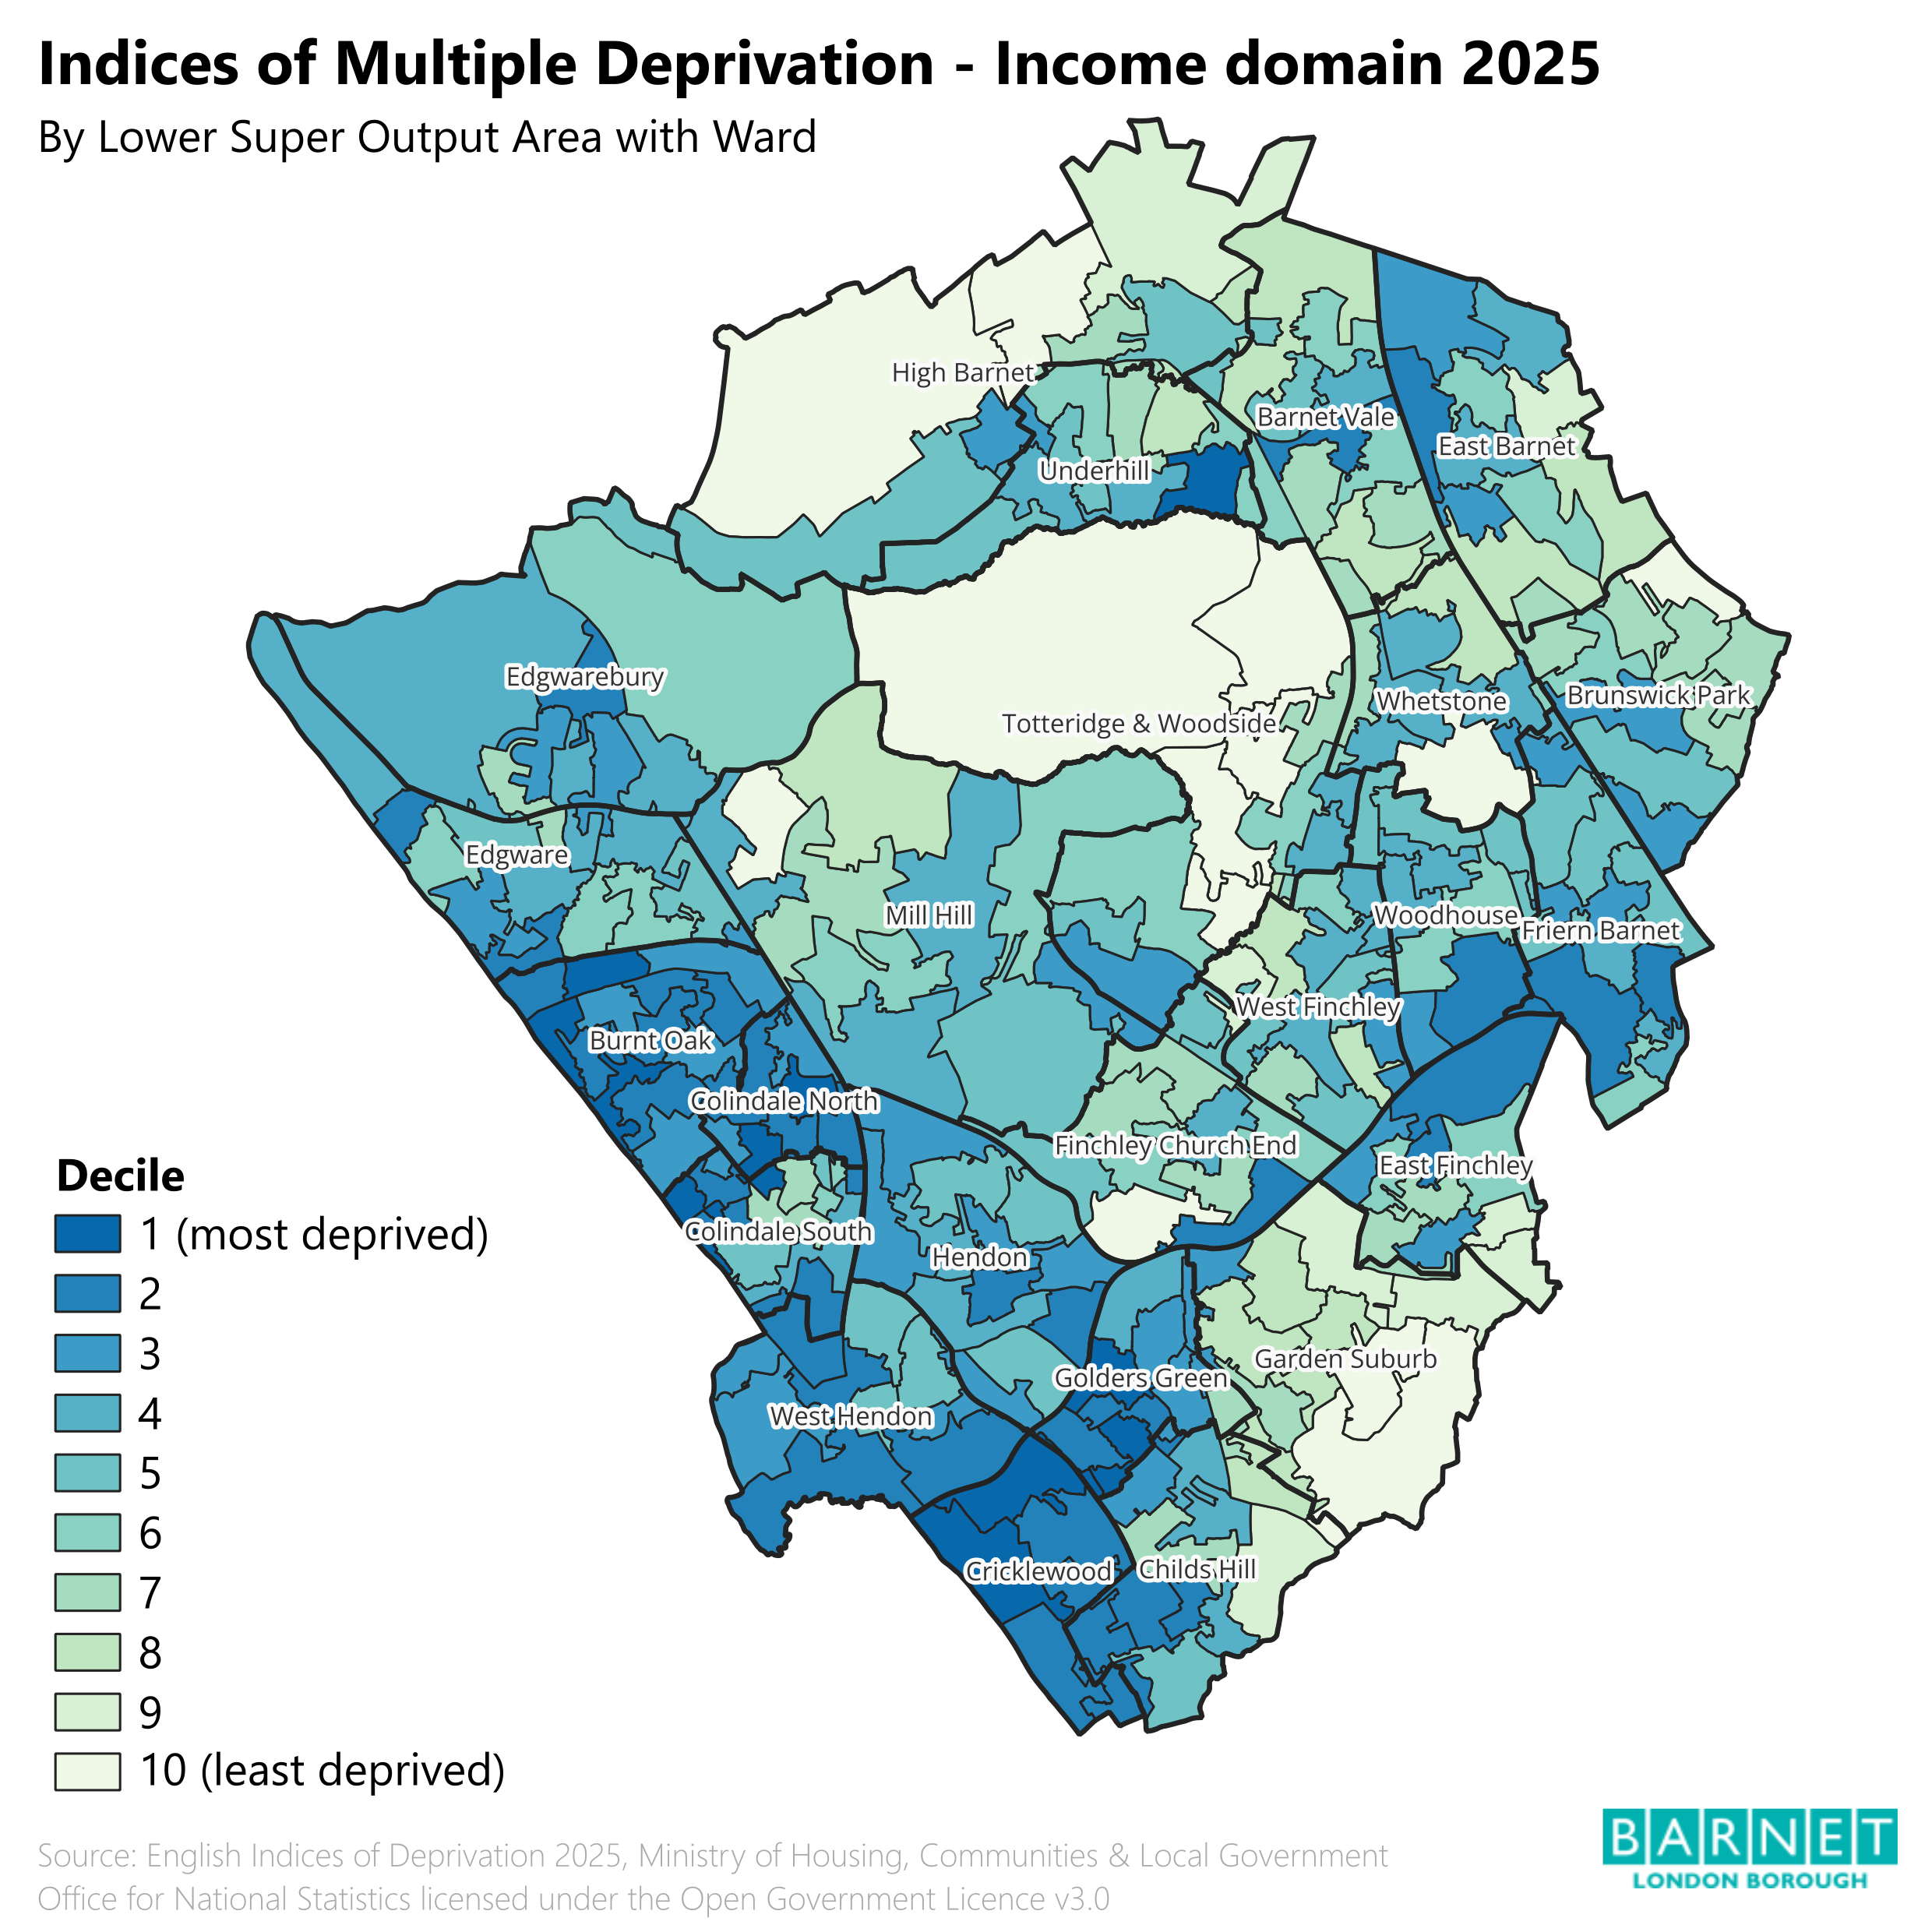
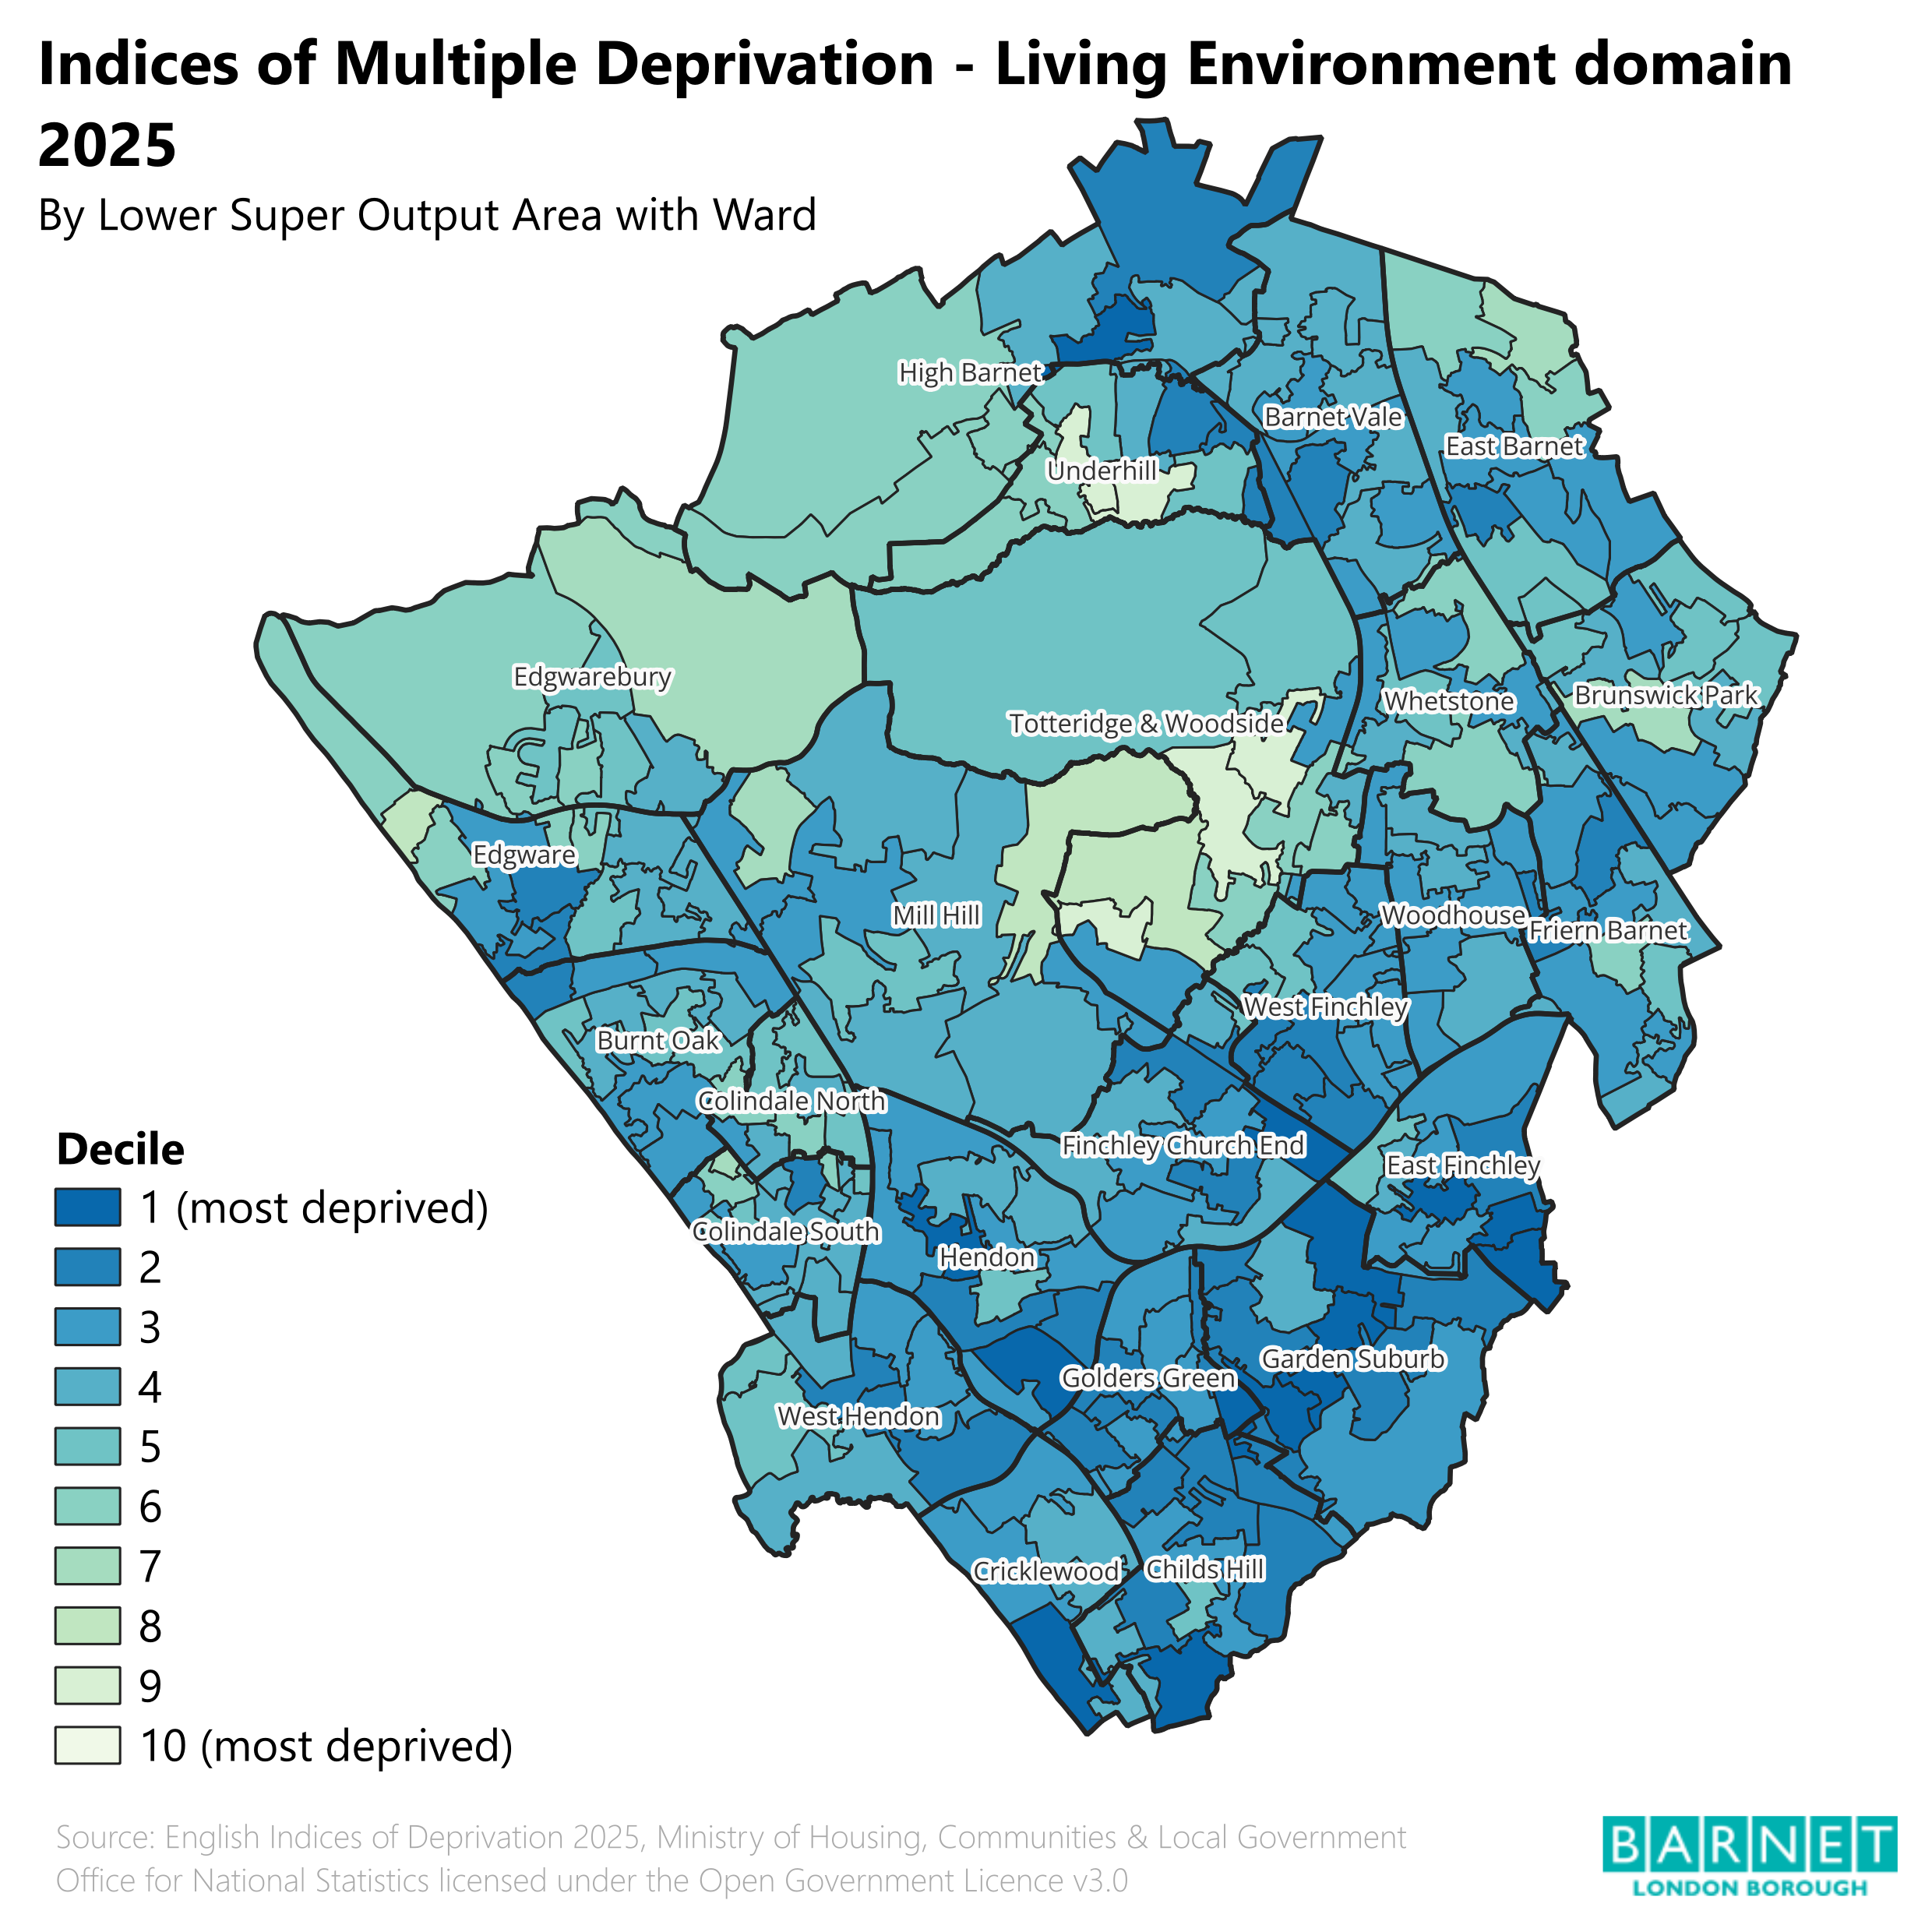
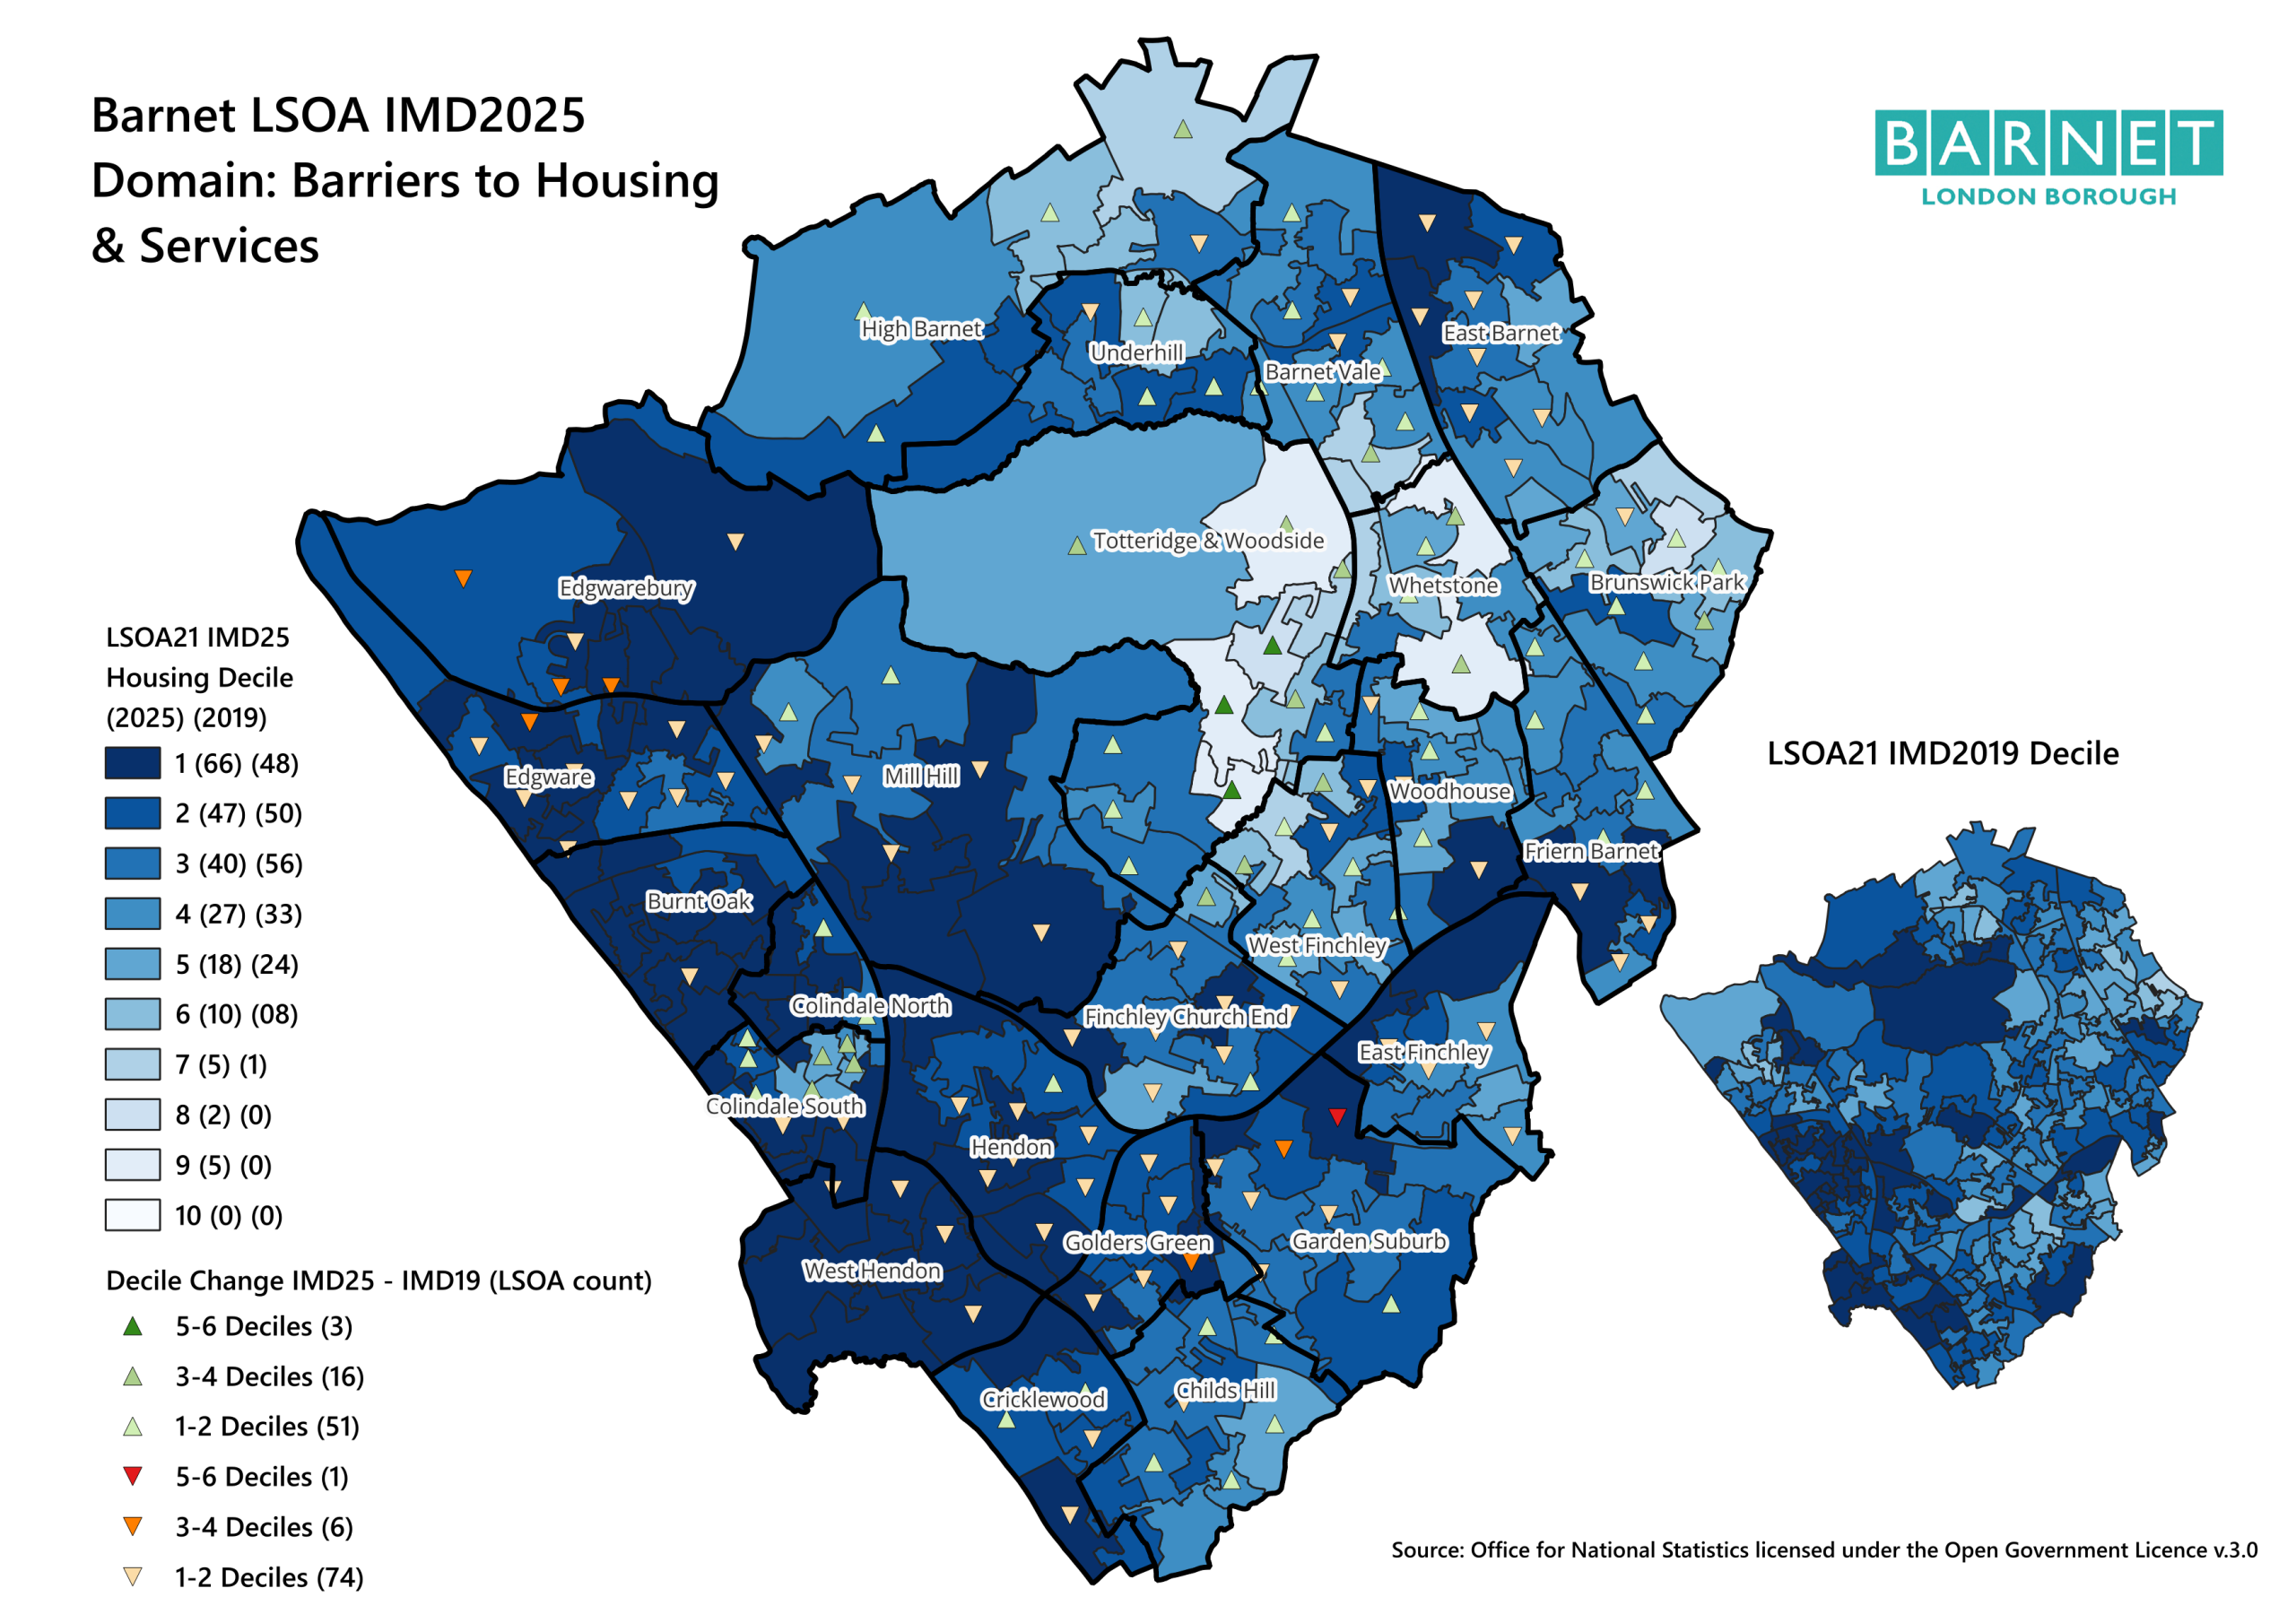
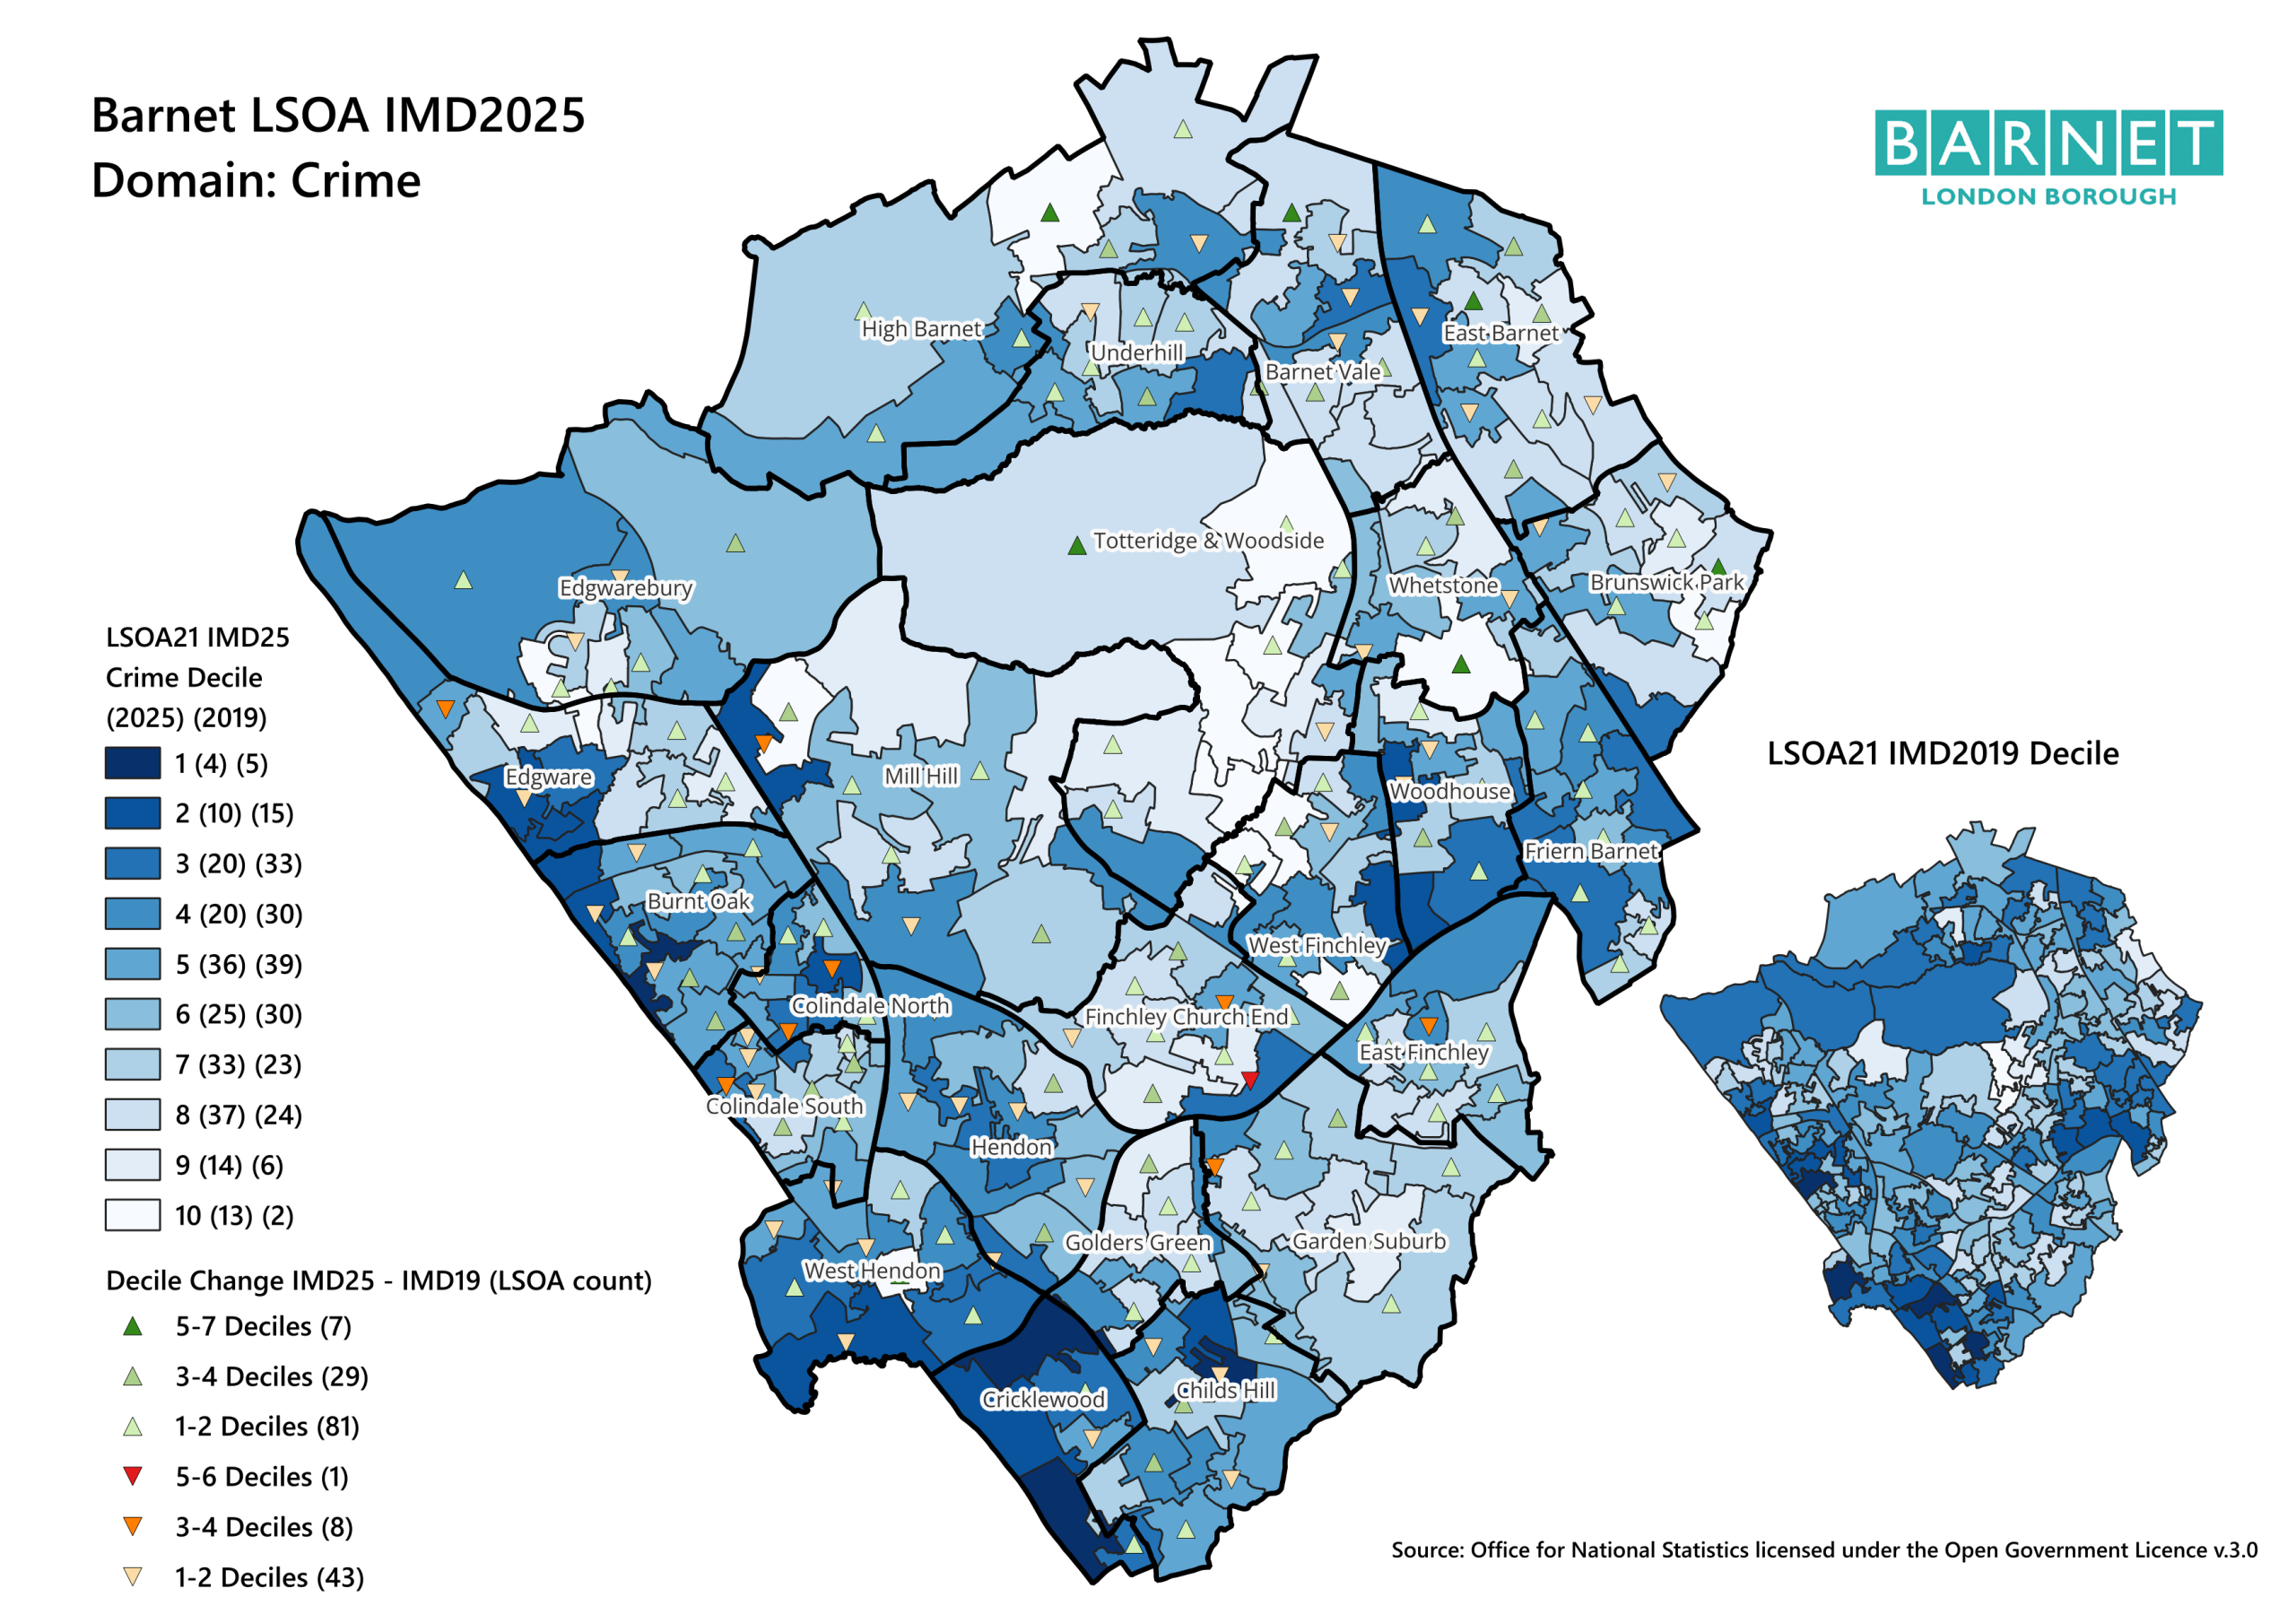
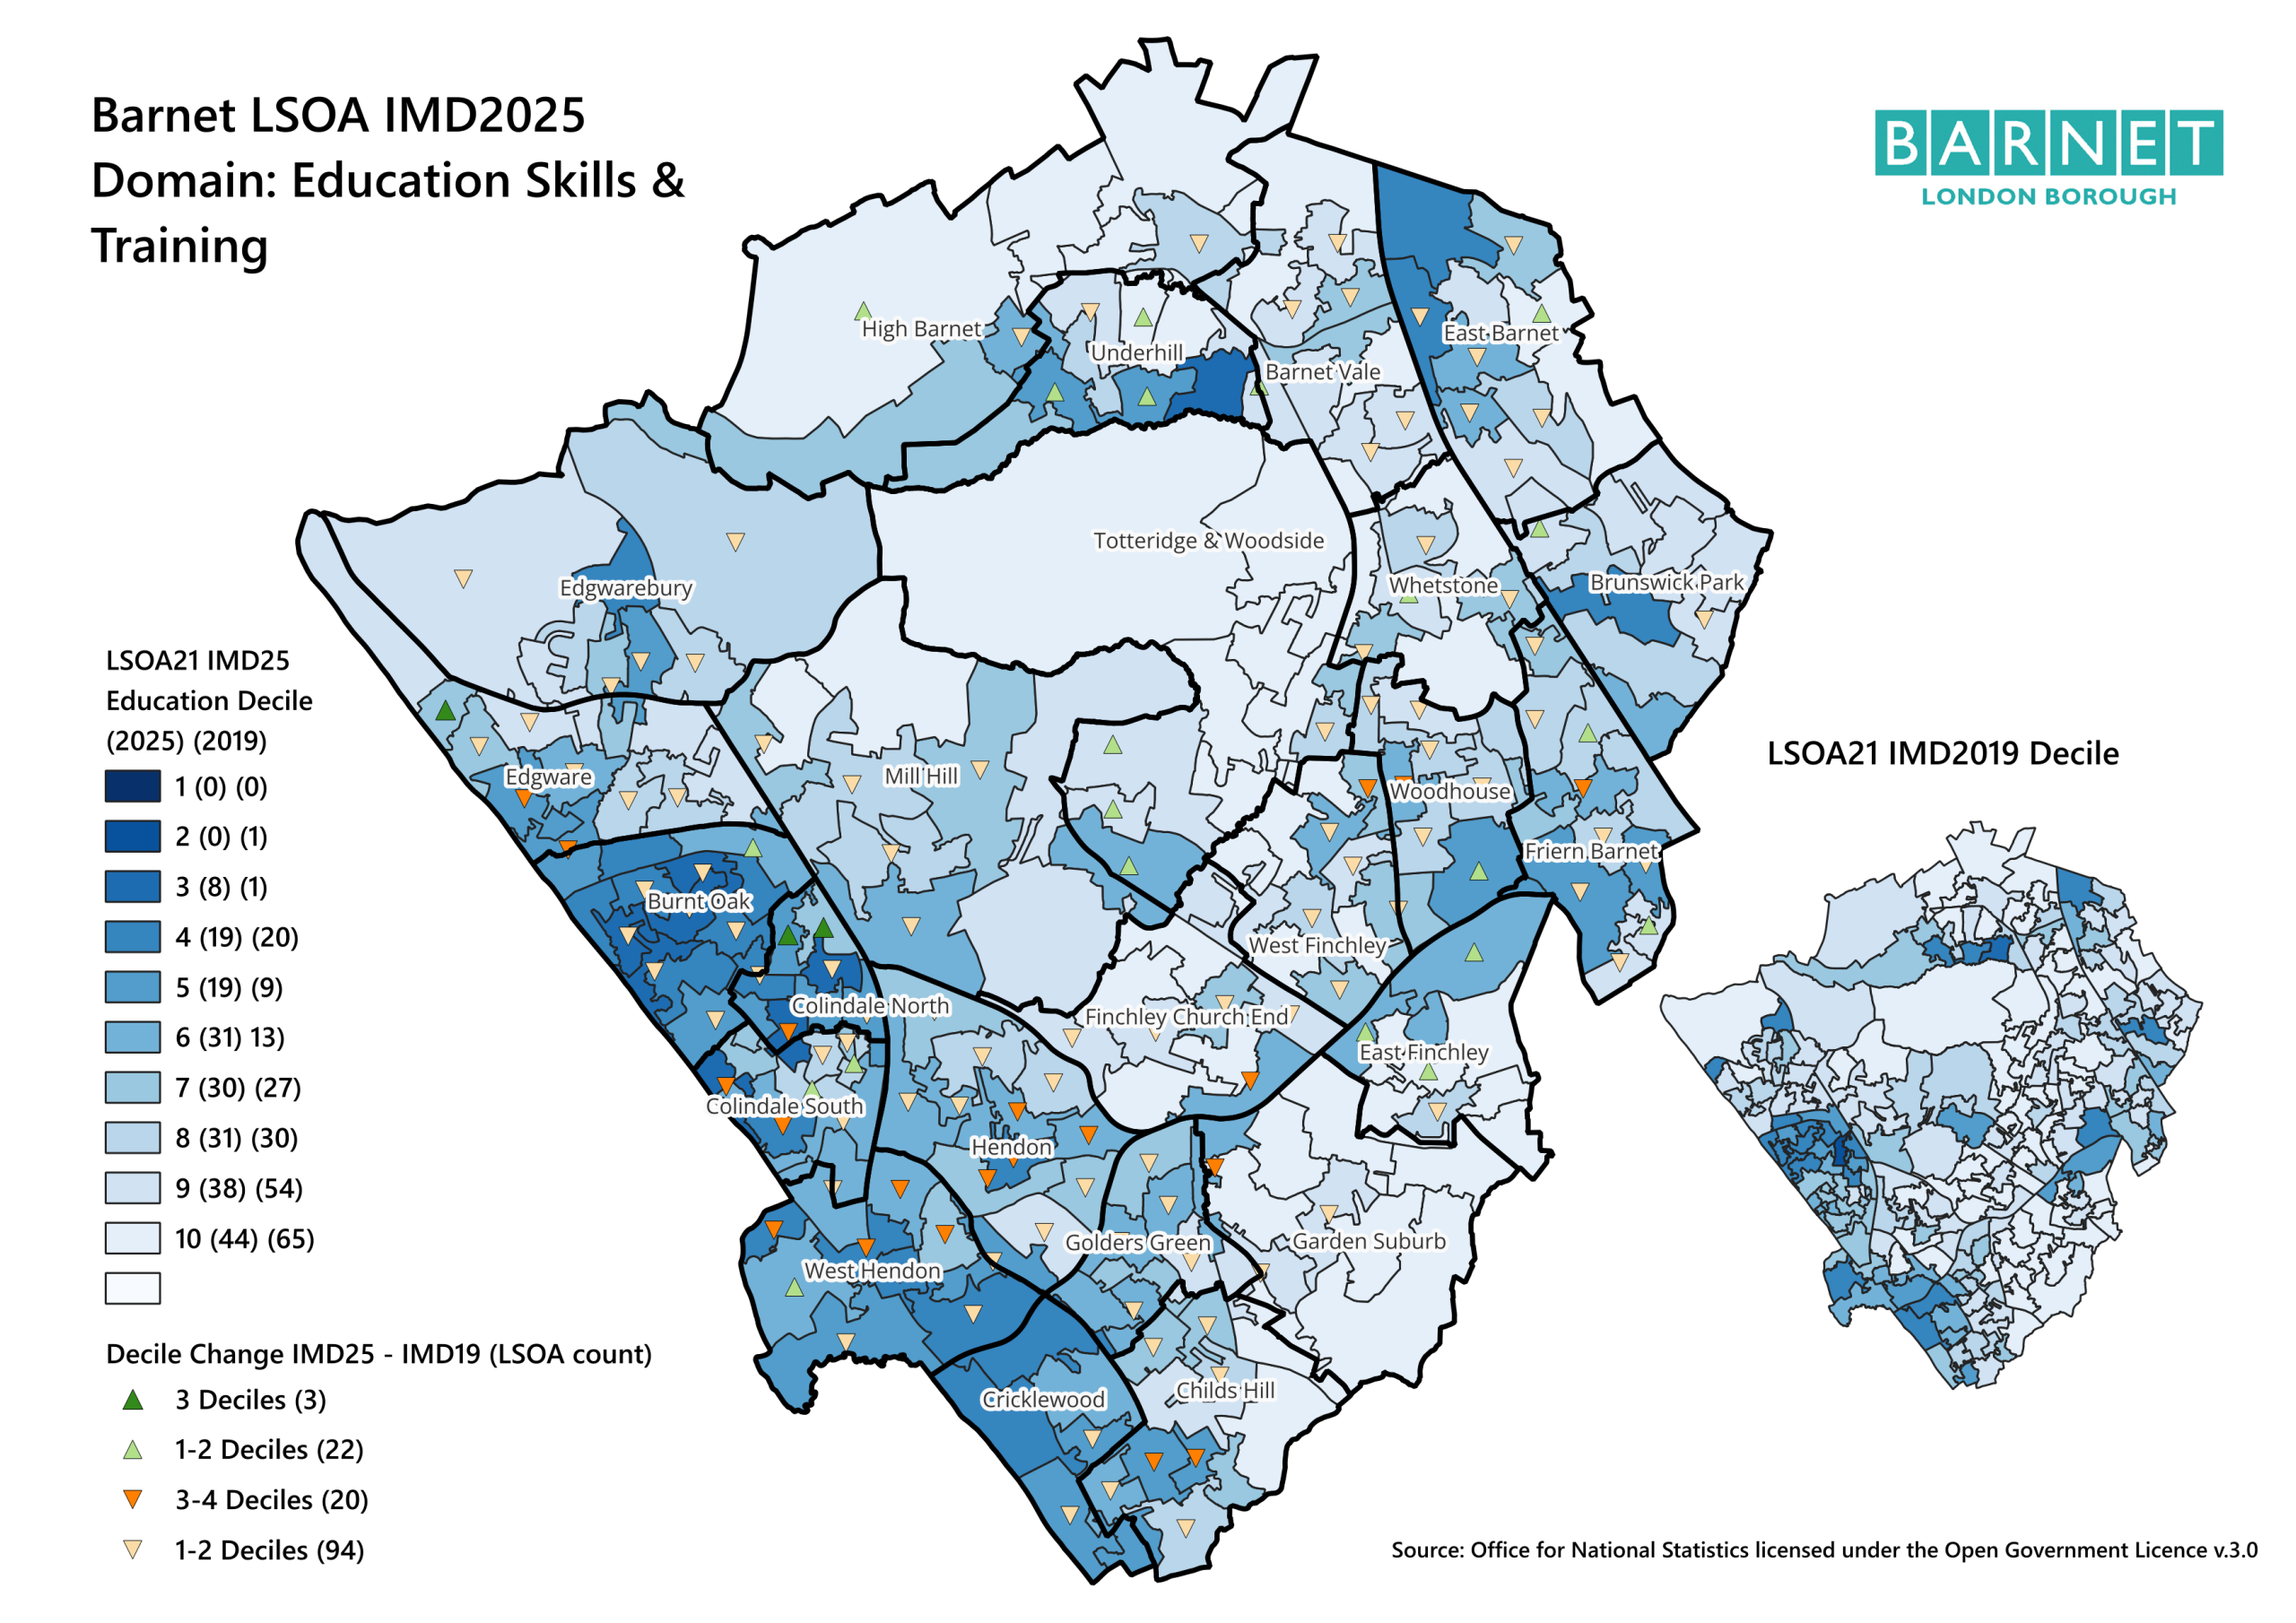
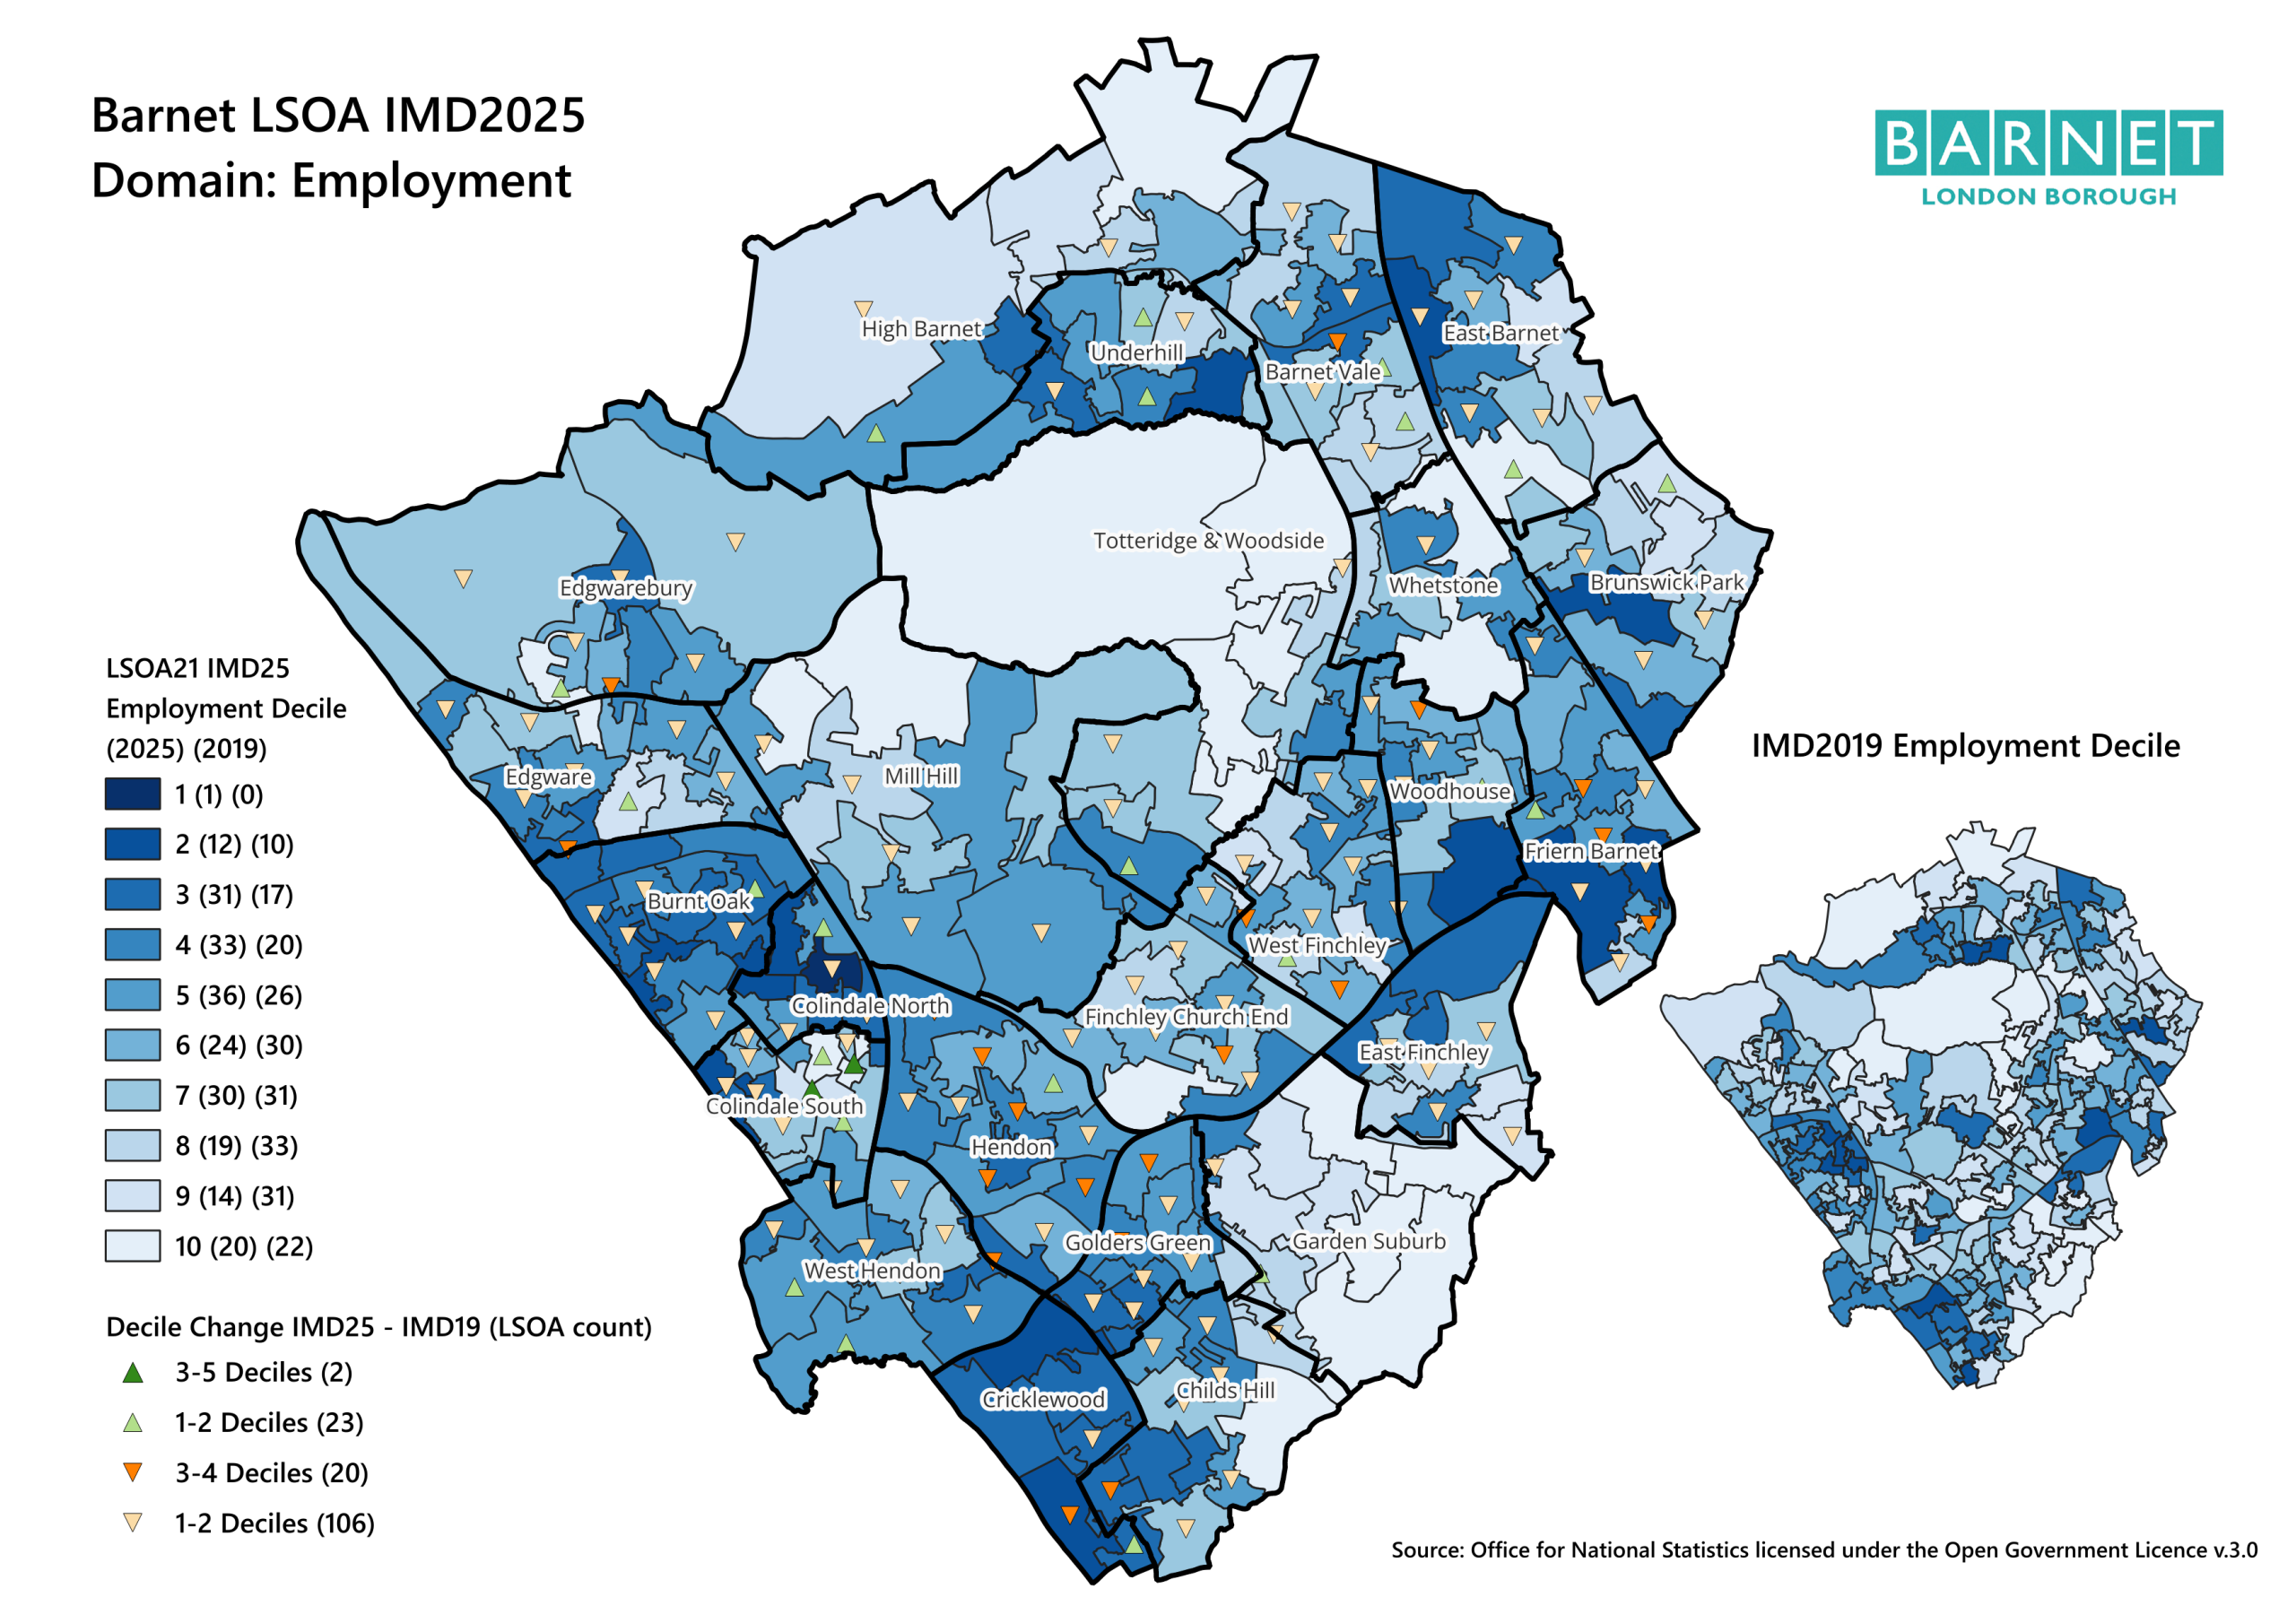
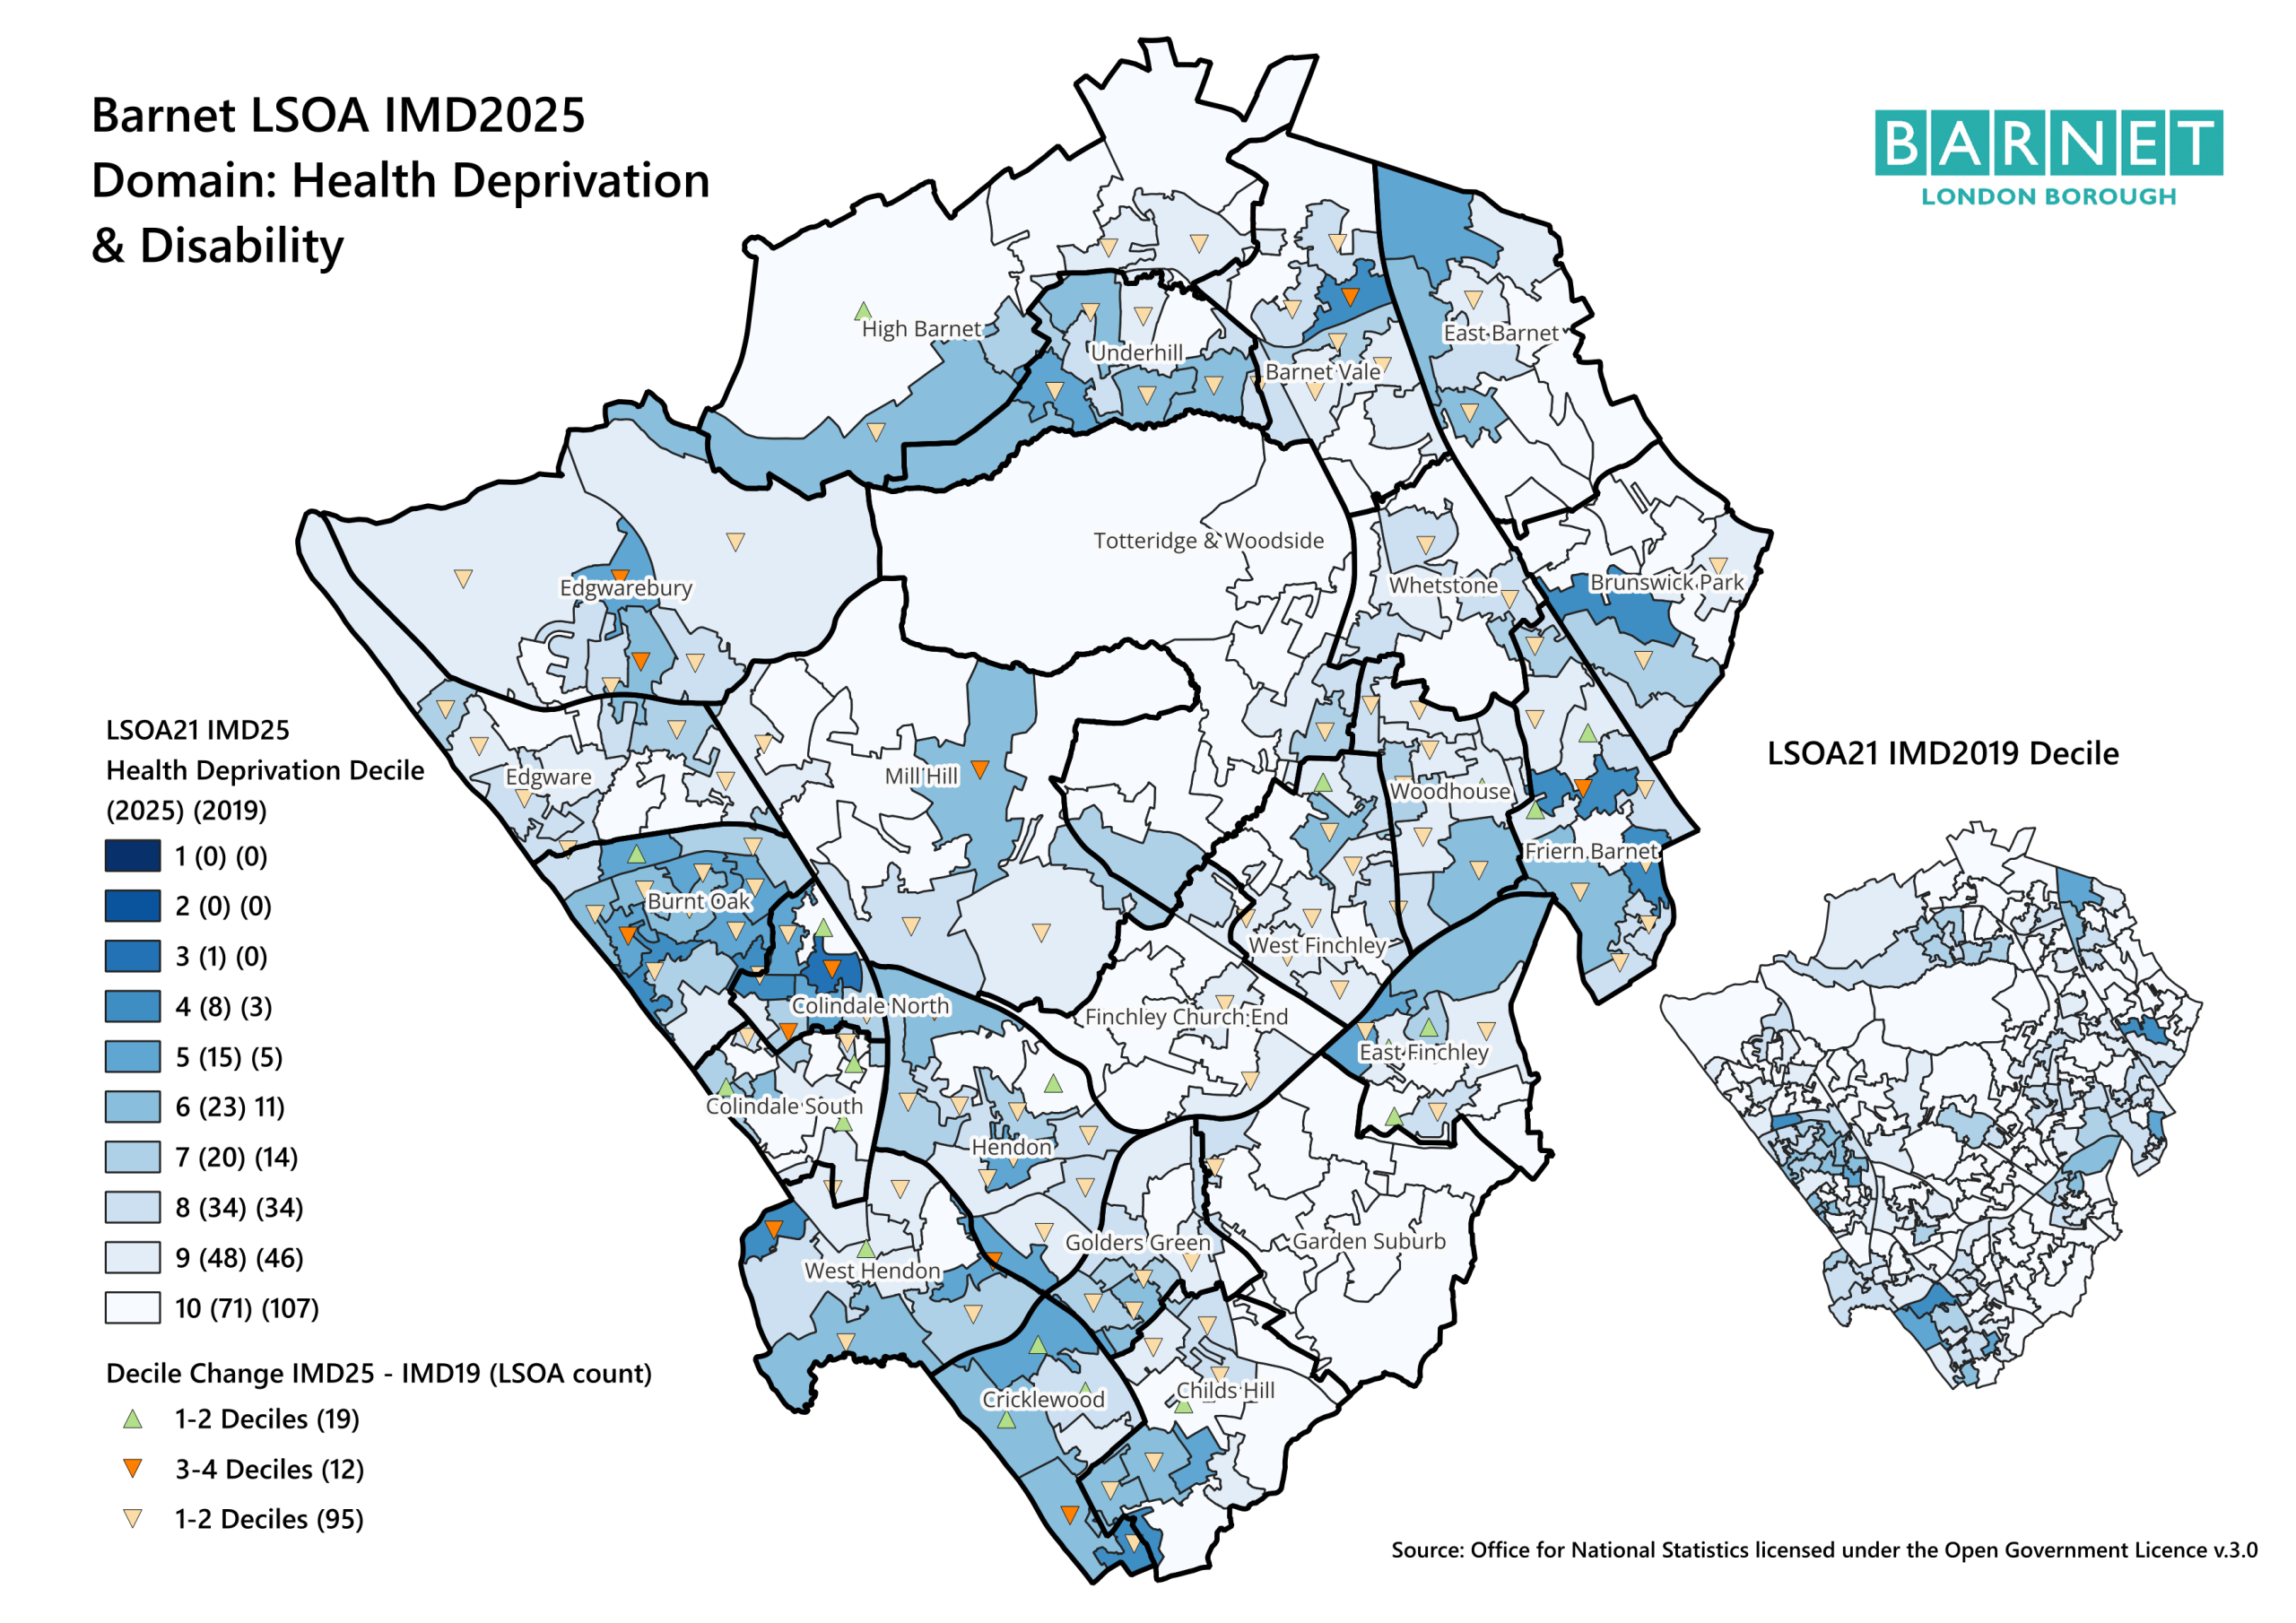
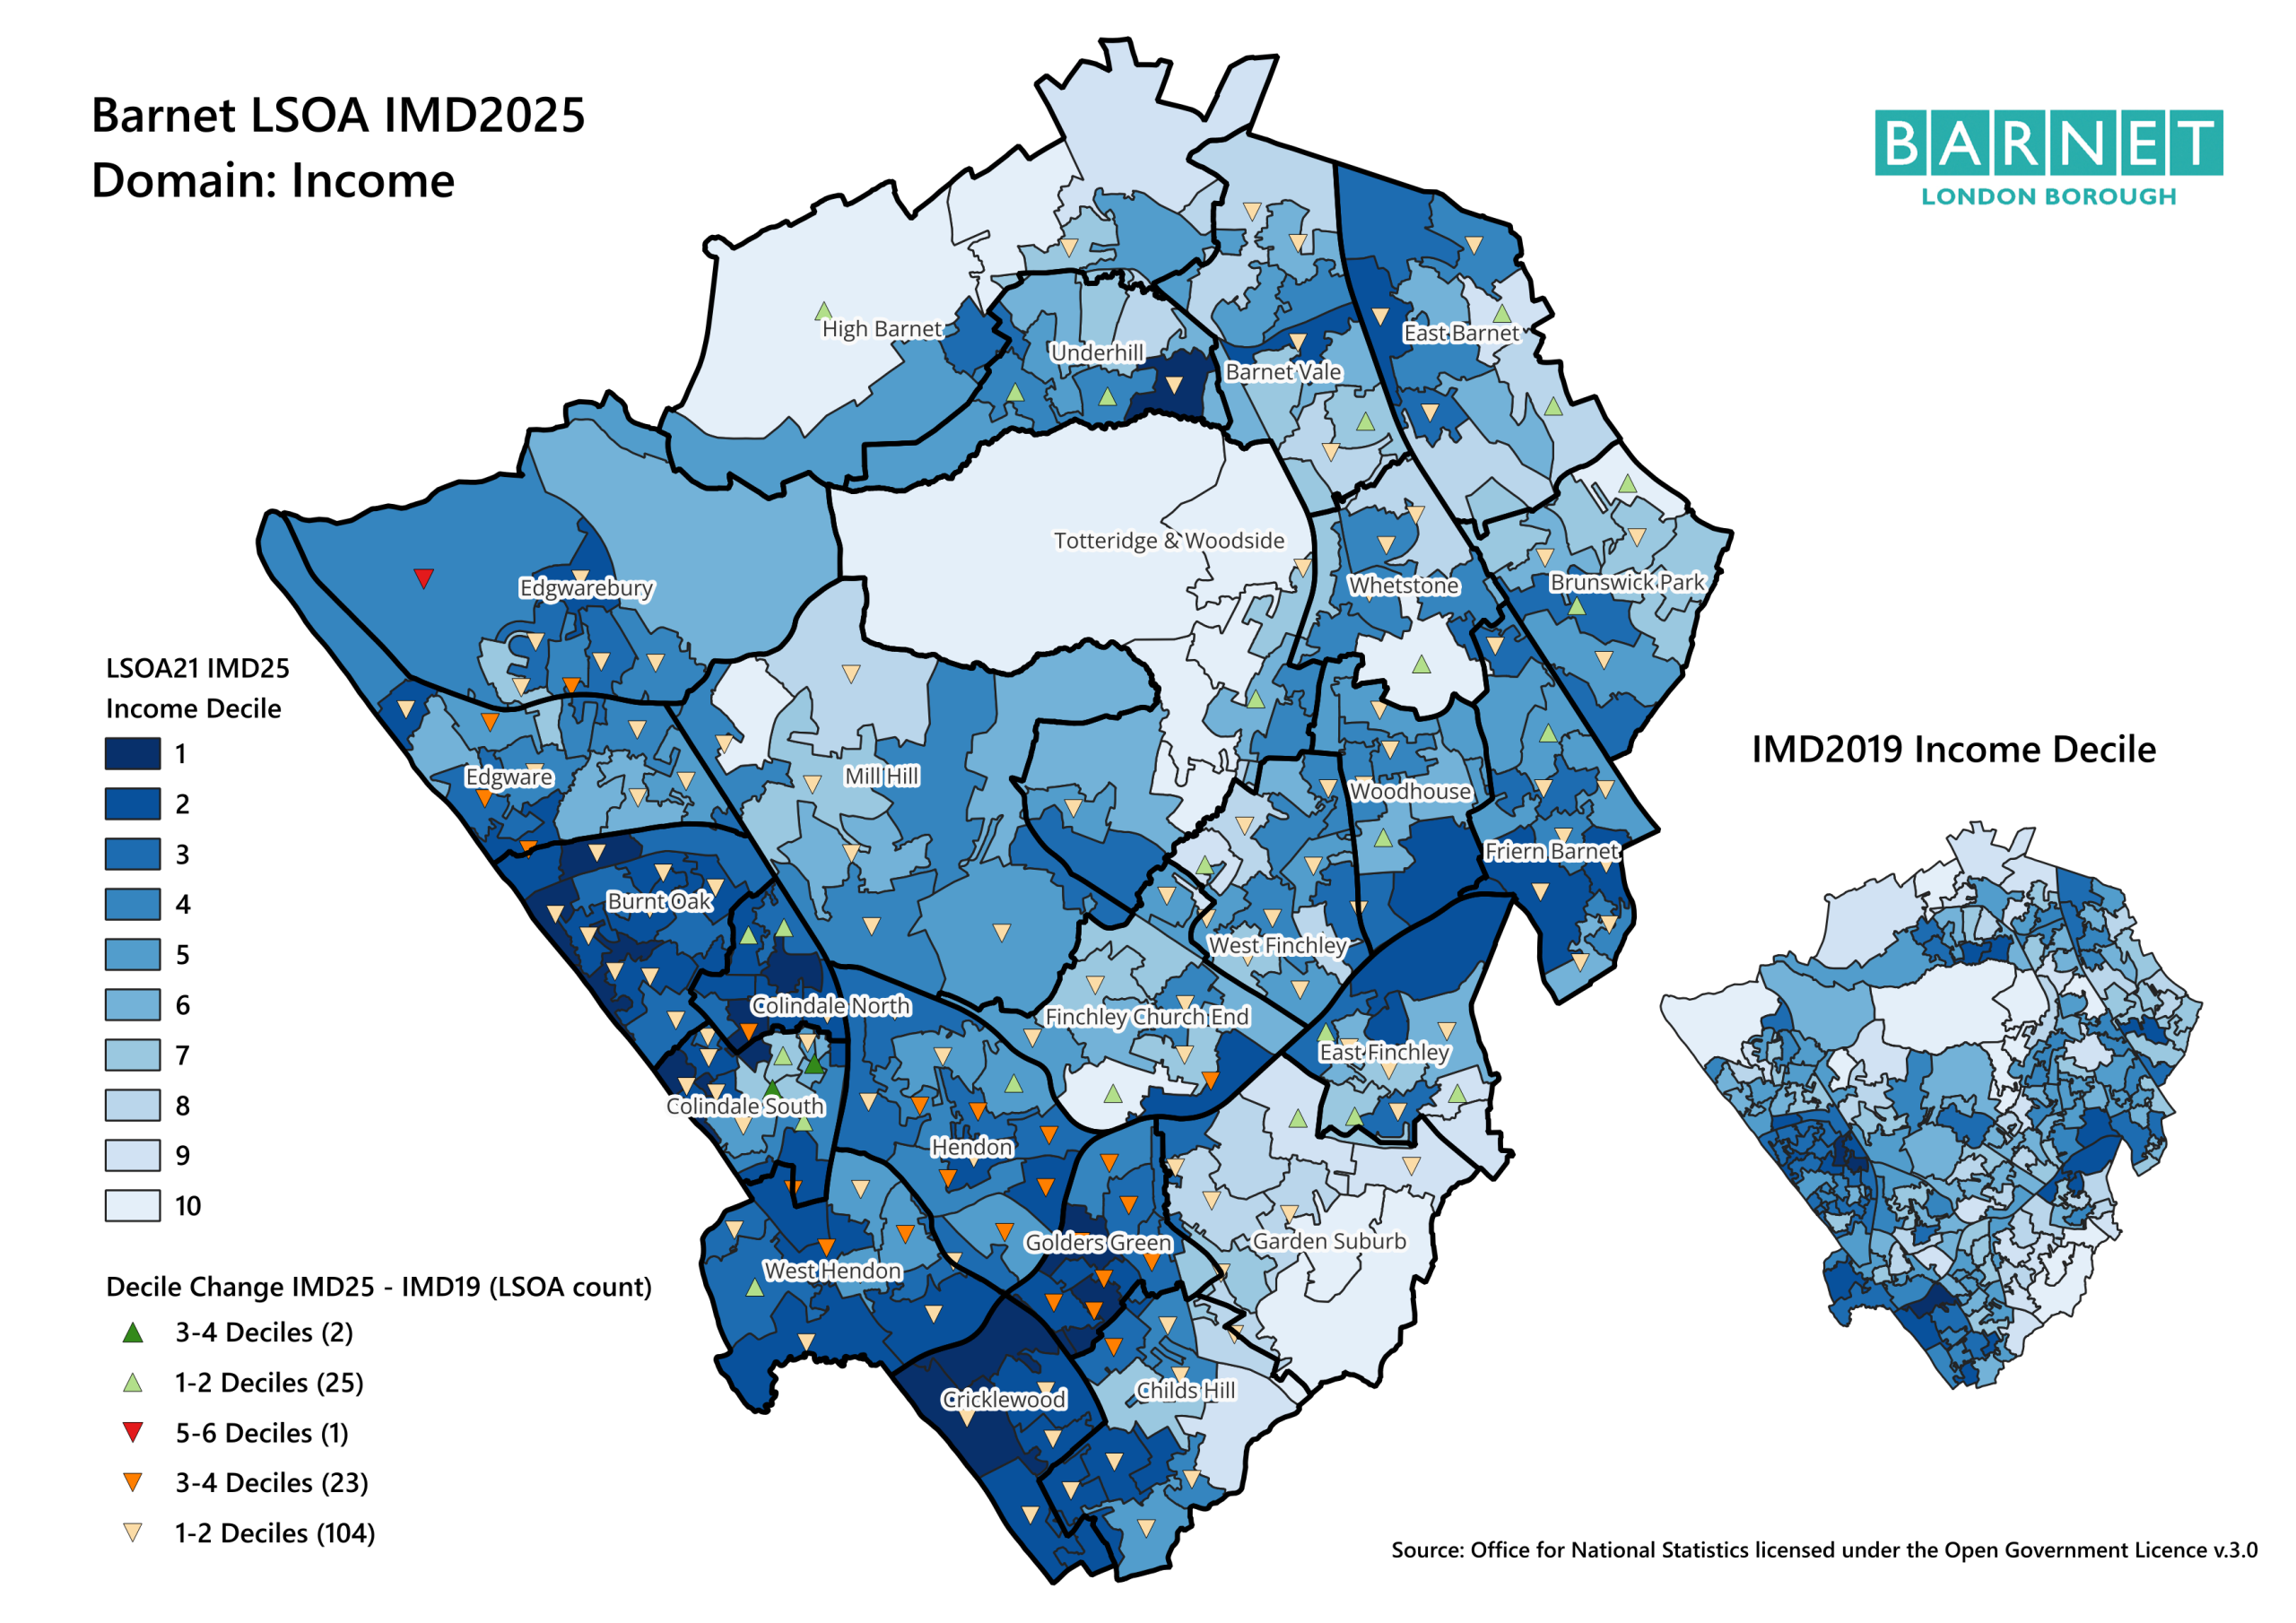
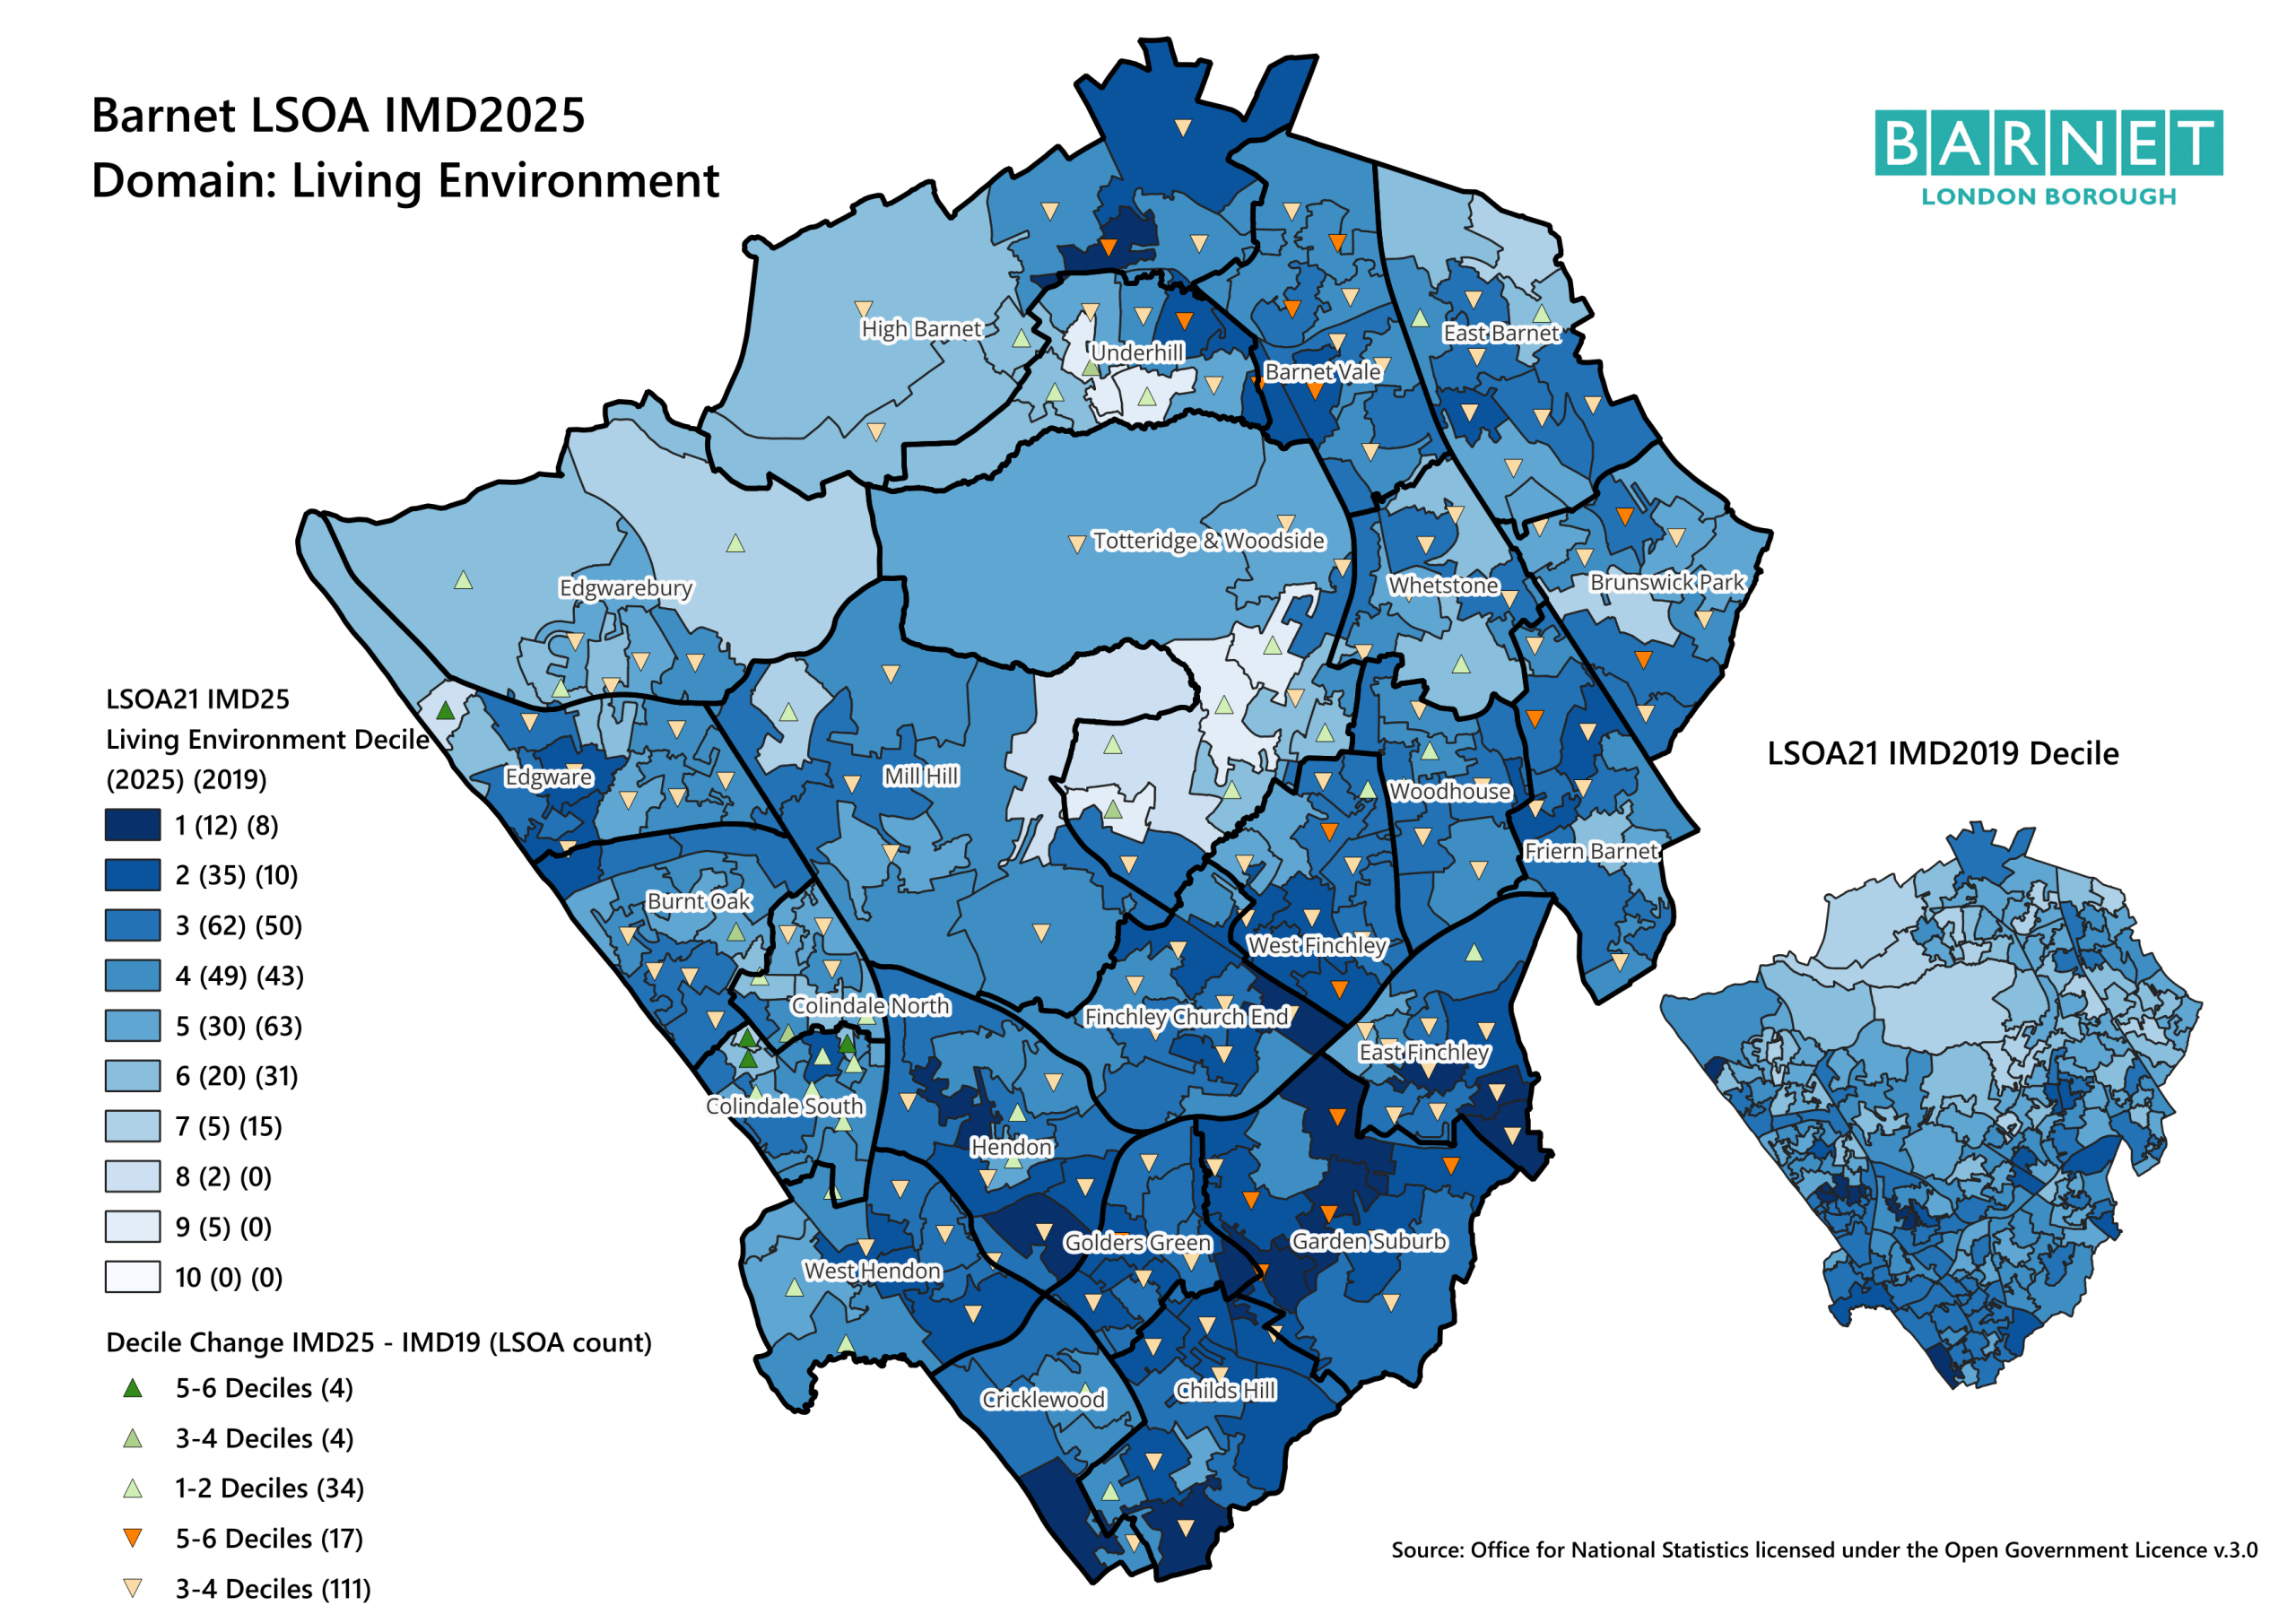
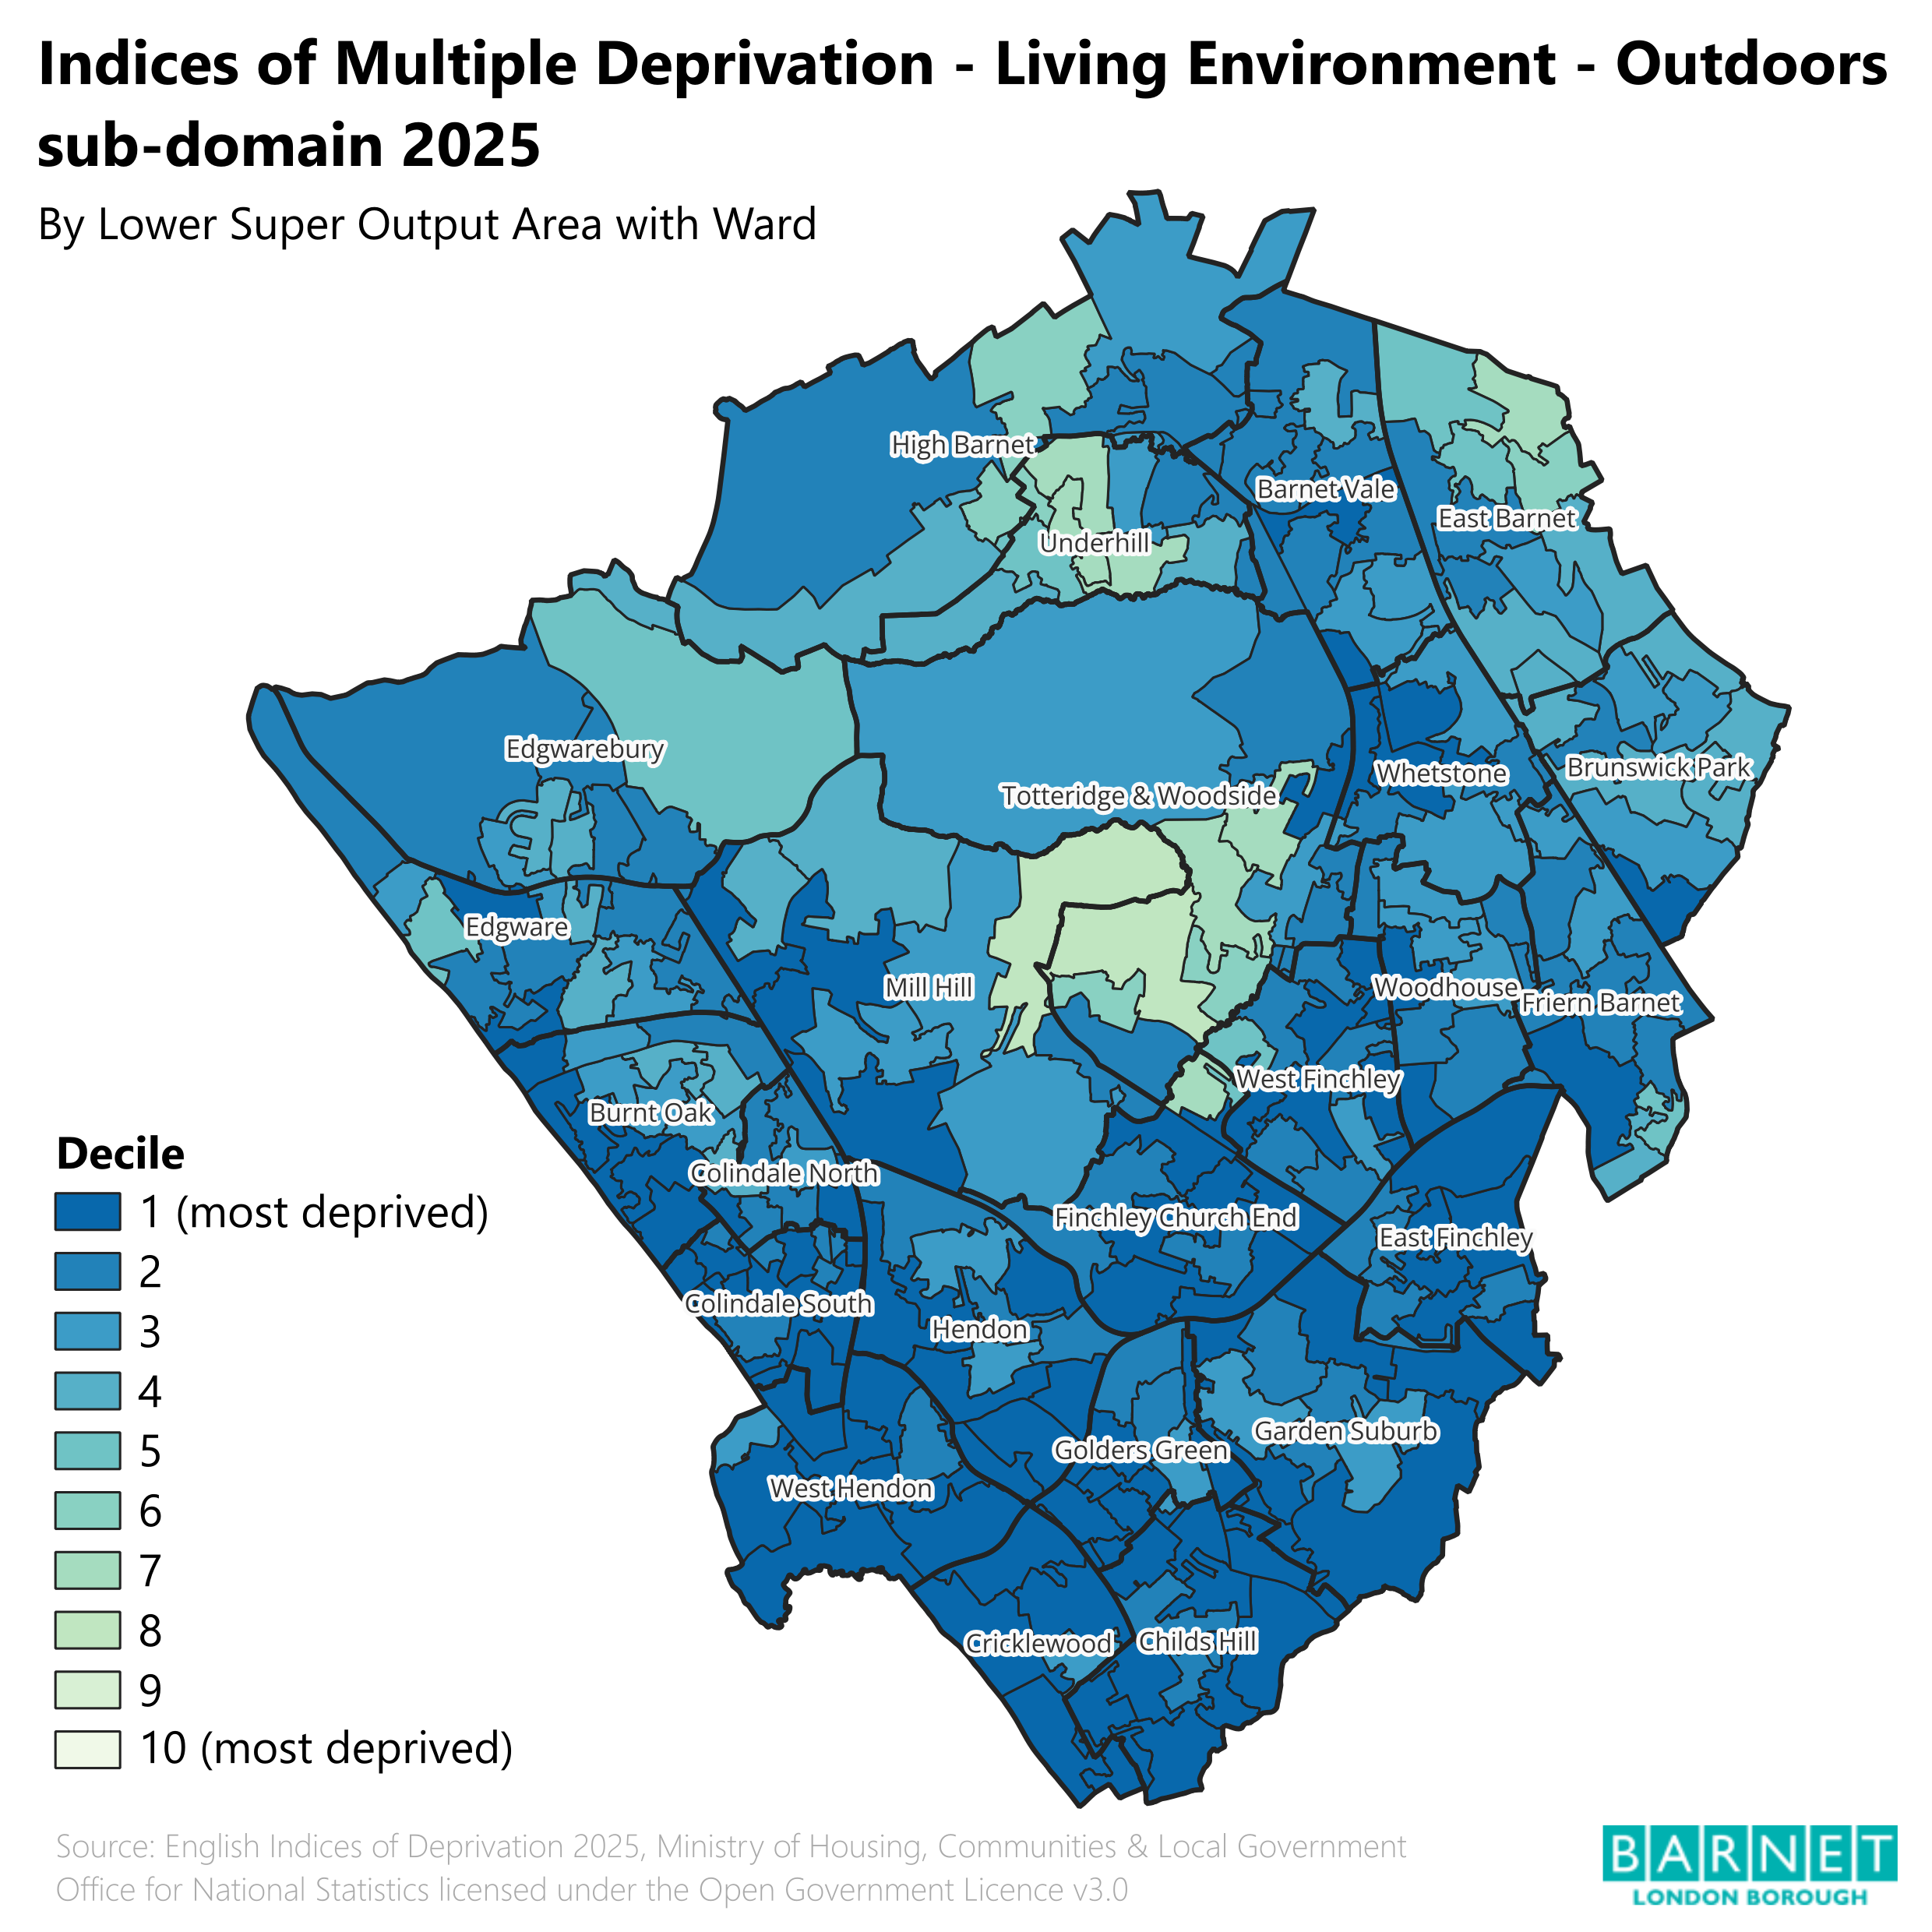
Maps showing the seven individual domains of deprivation that combine to make the Index of Multiple Deprivation:

Maps showing the change in seven individual domains of deprivation compared to the 2019 indices:

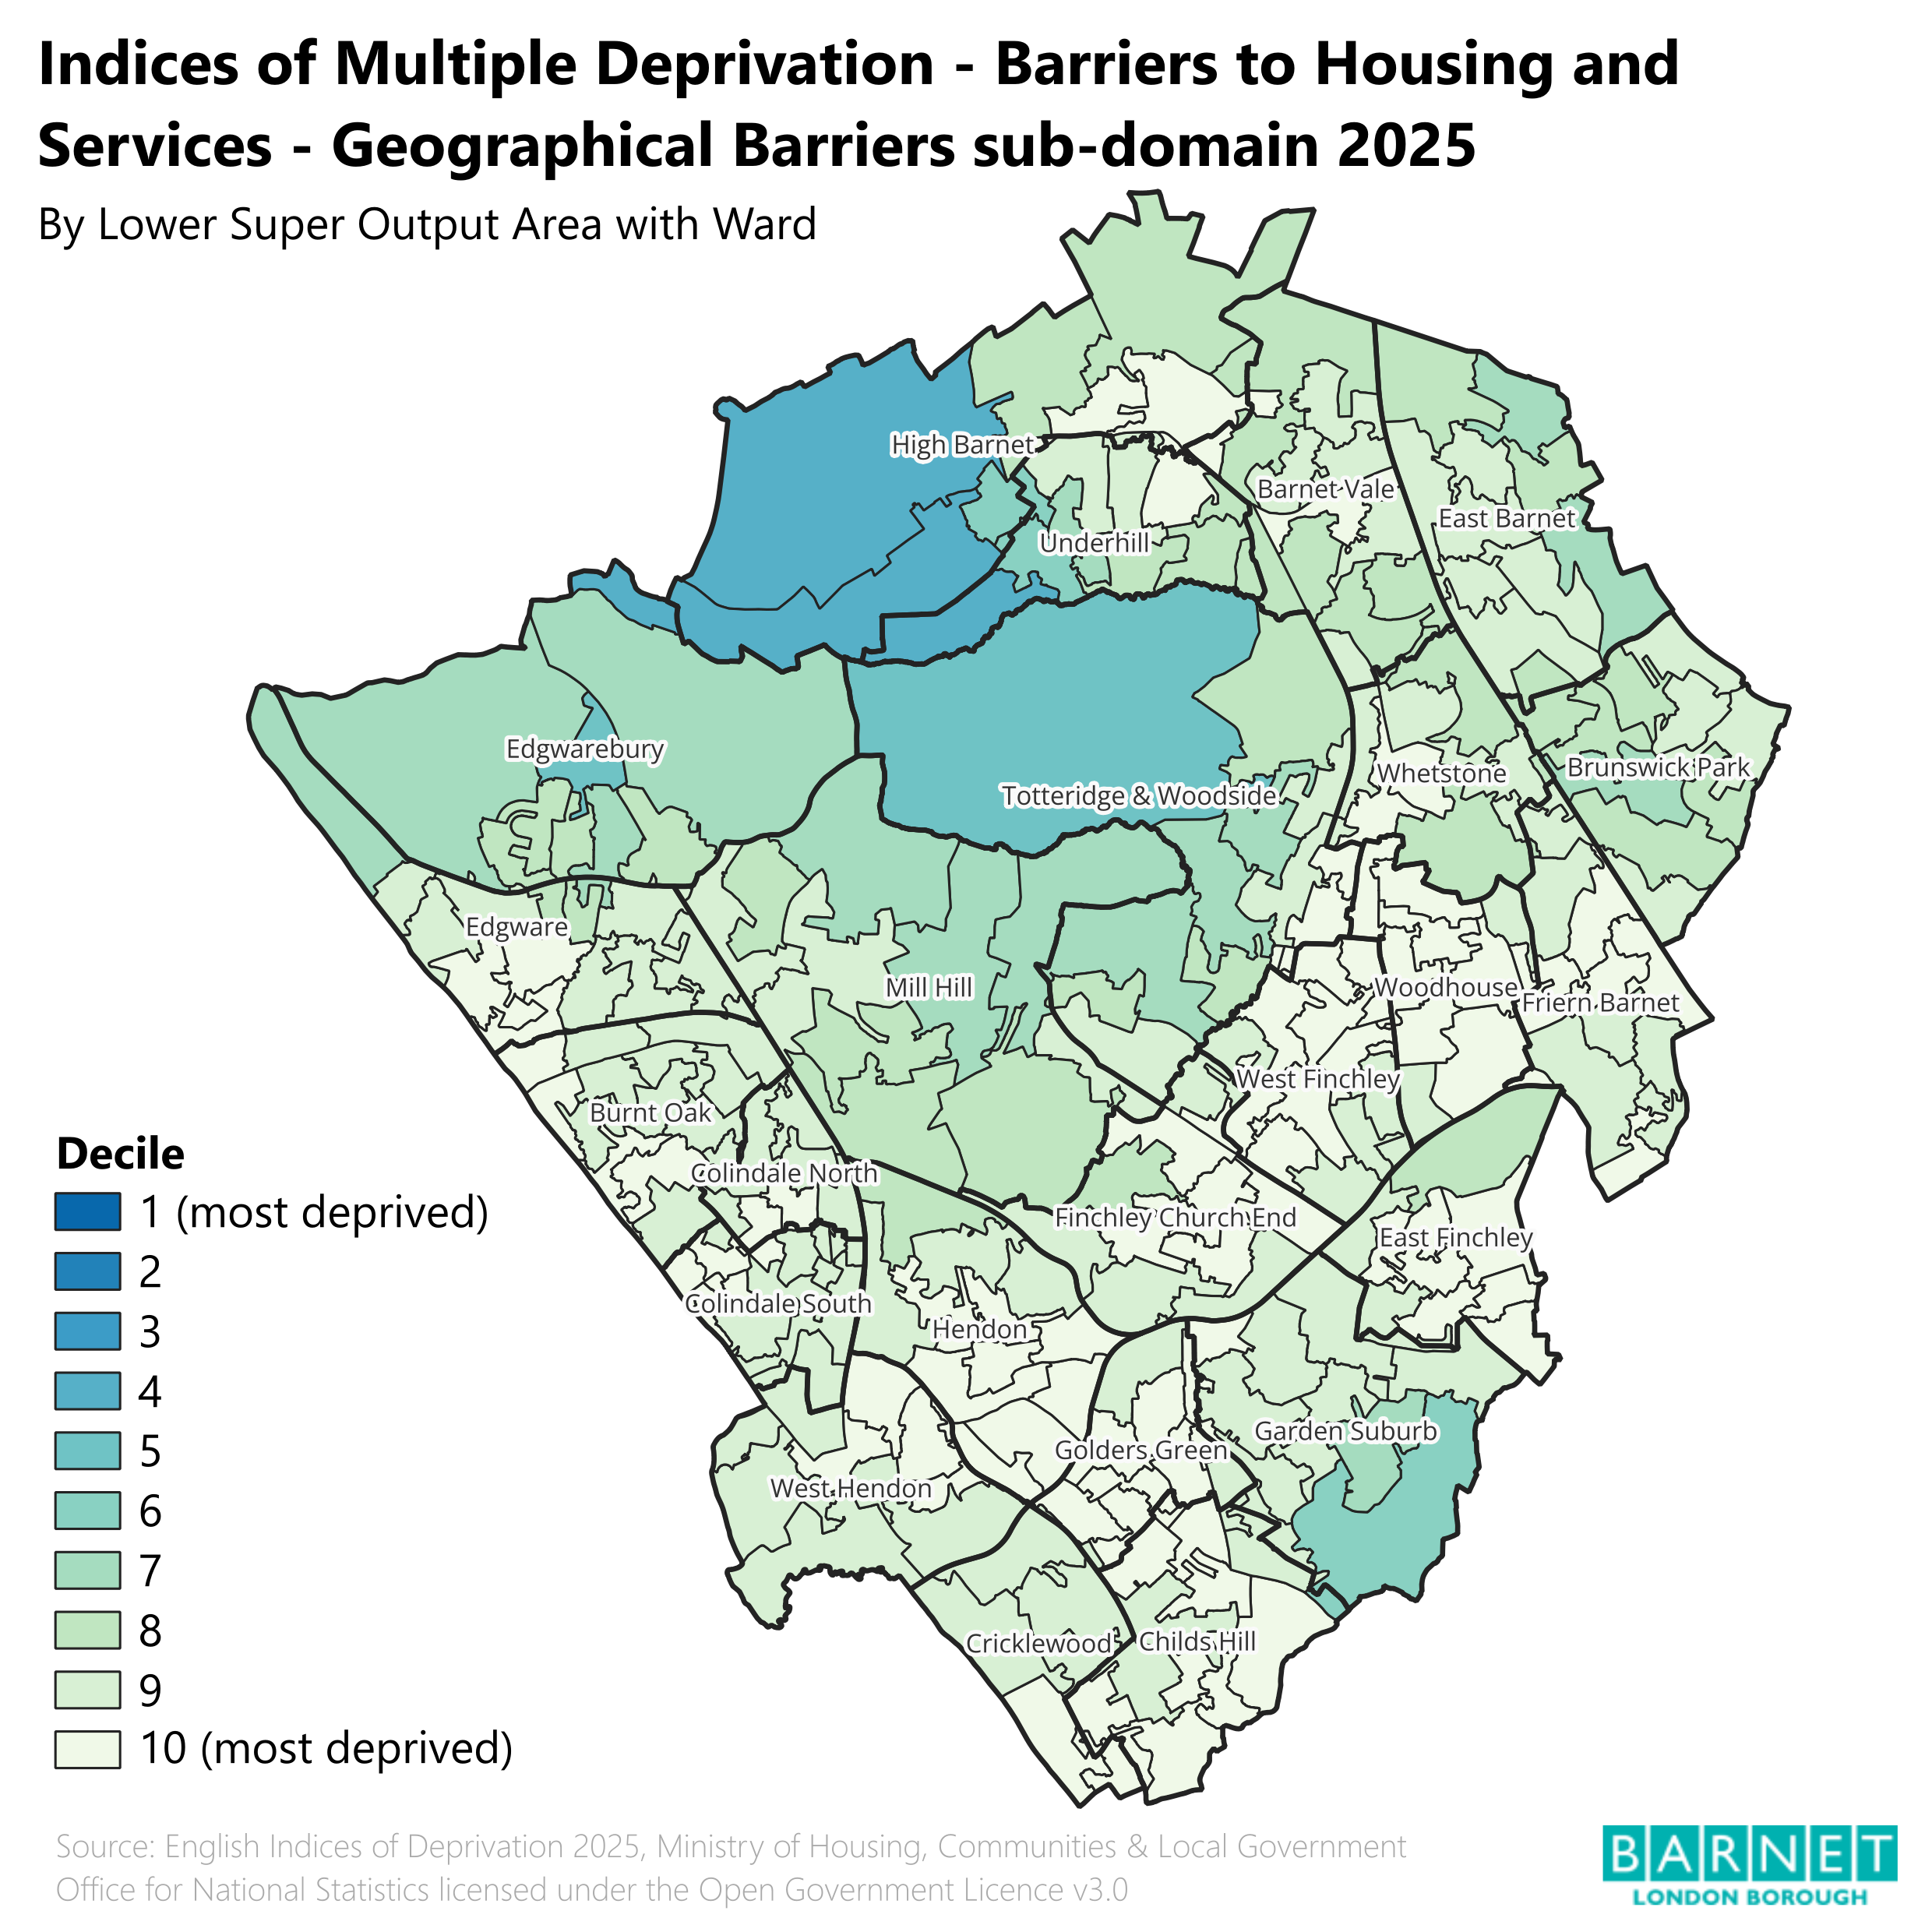
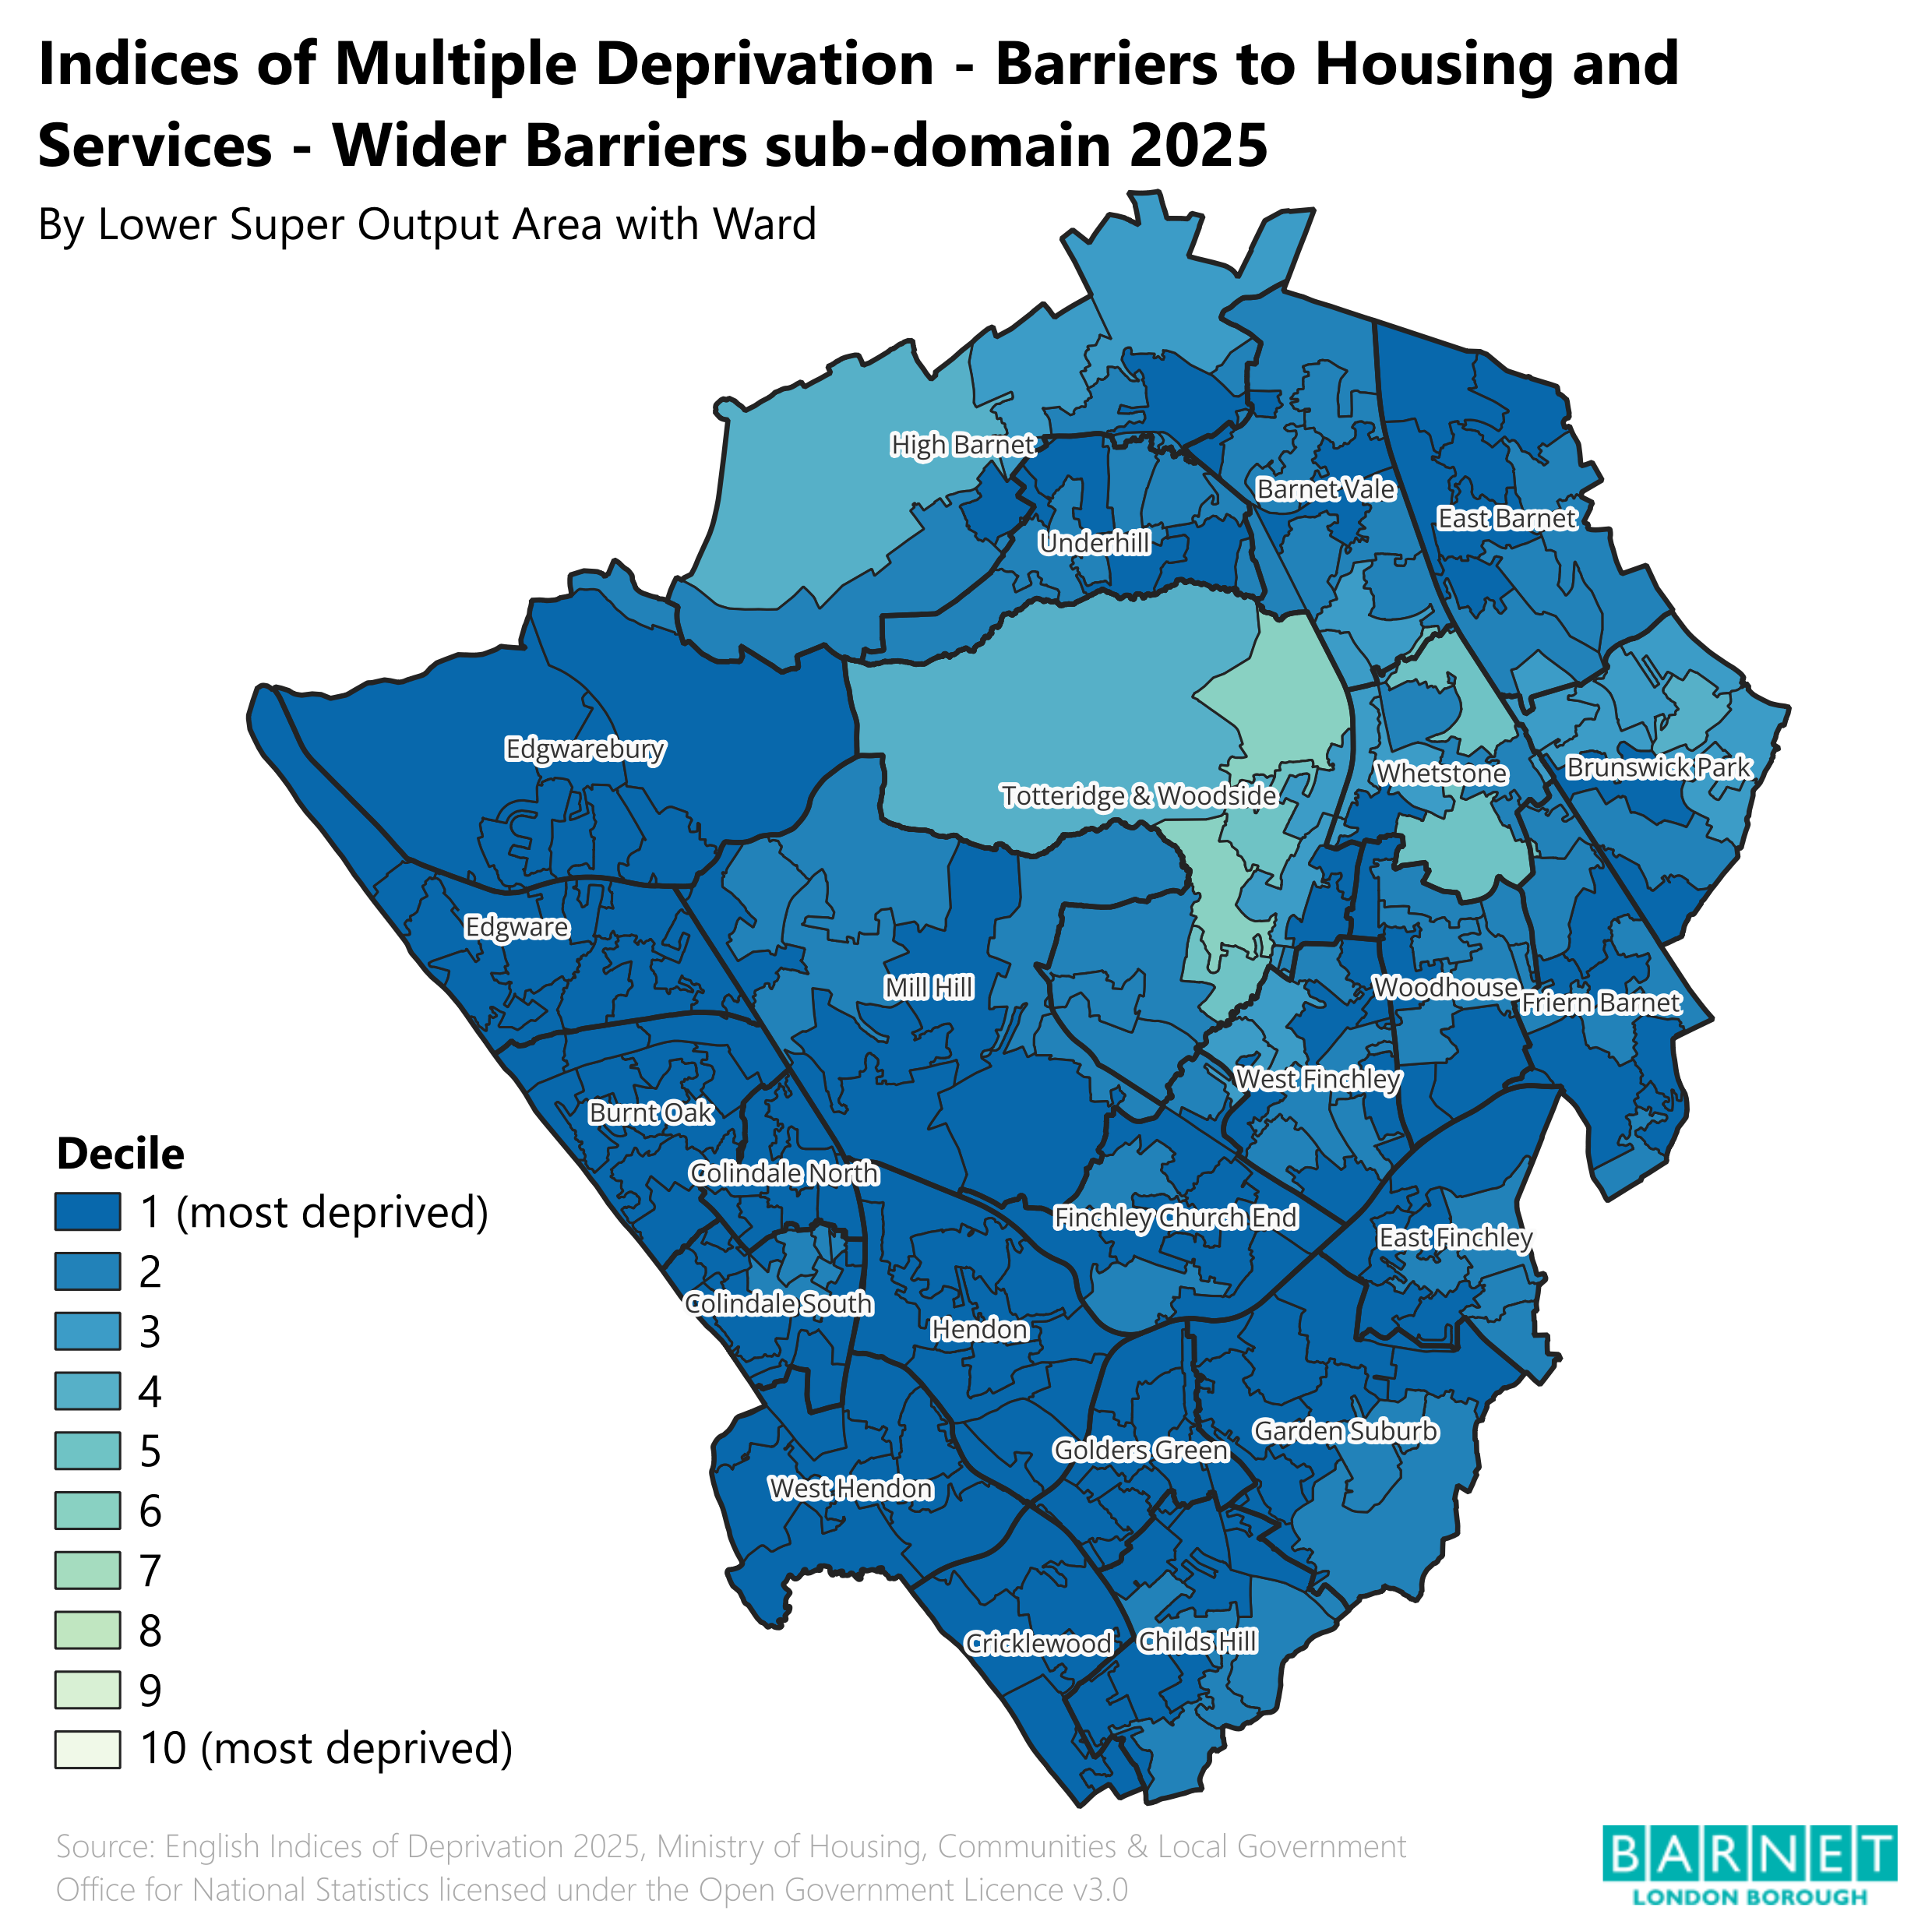
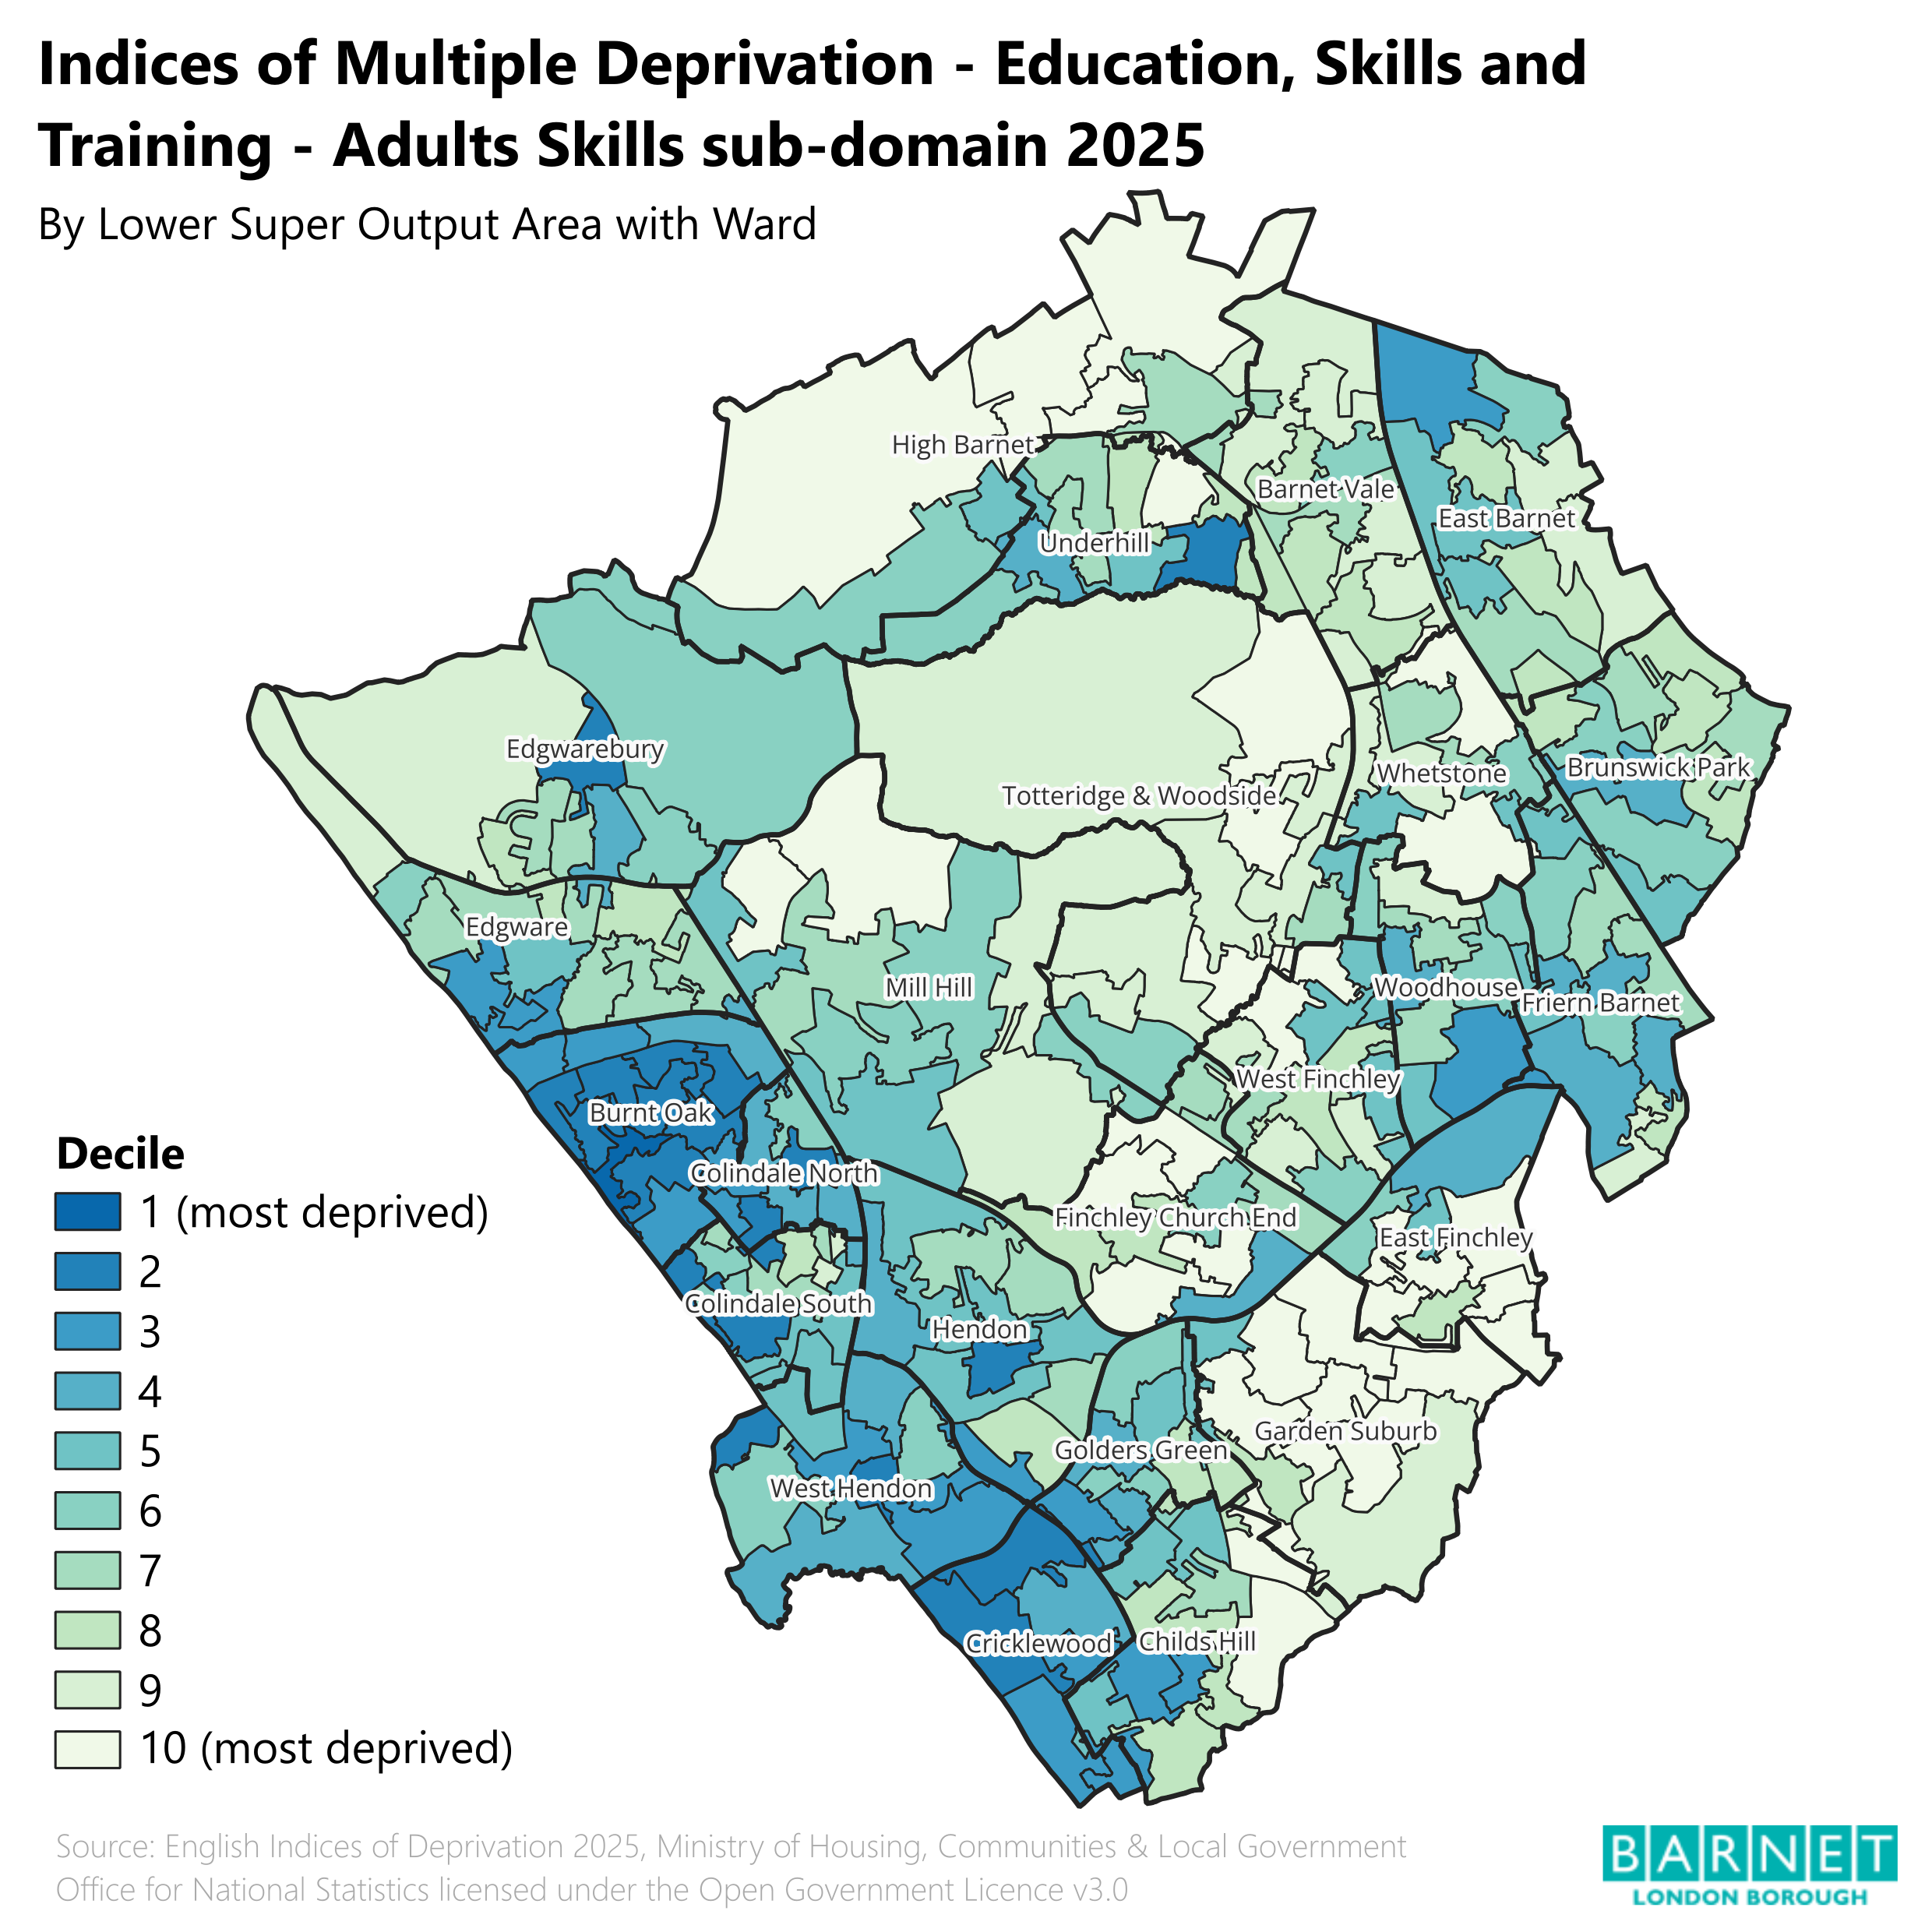
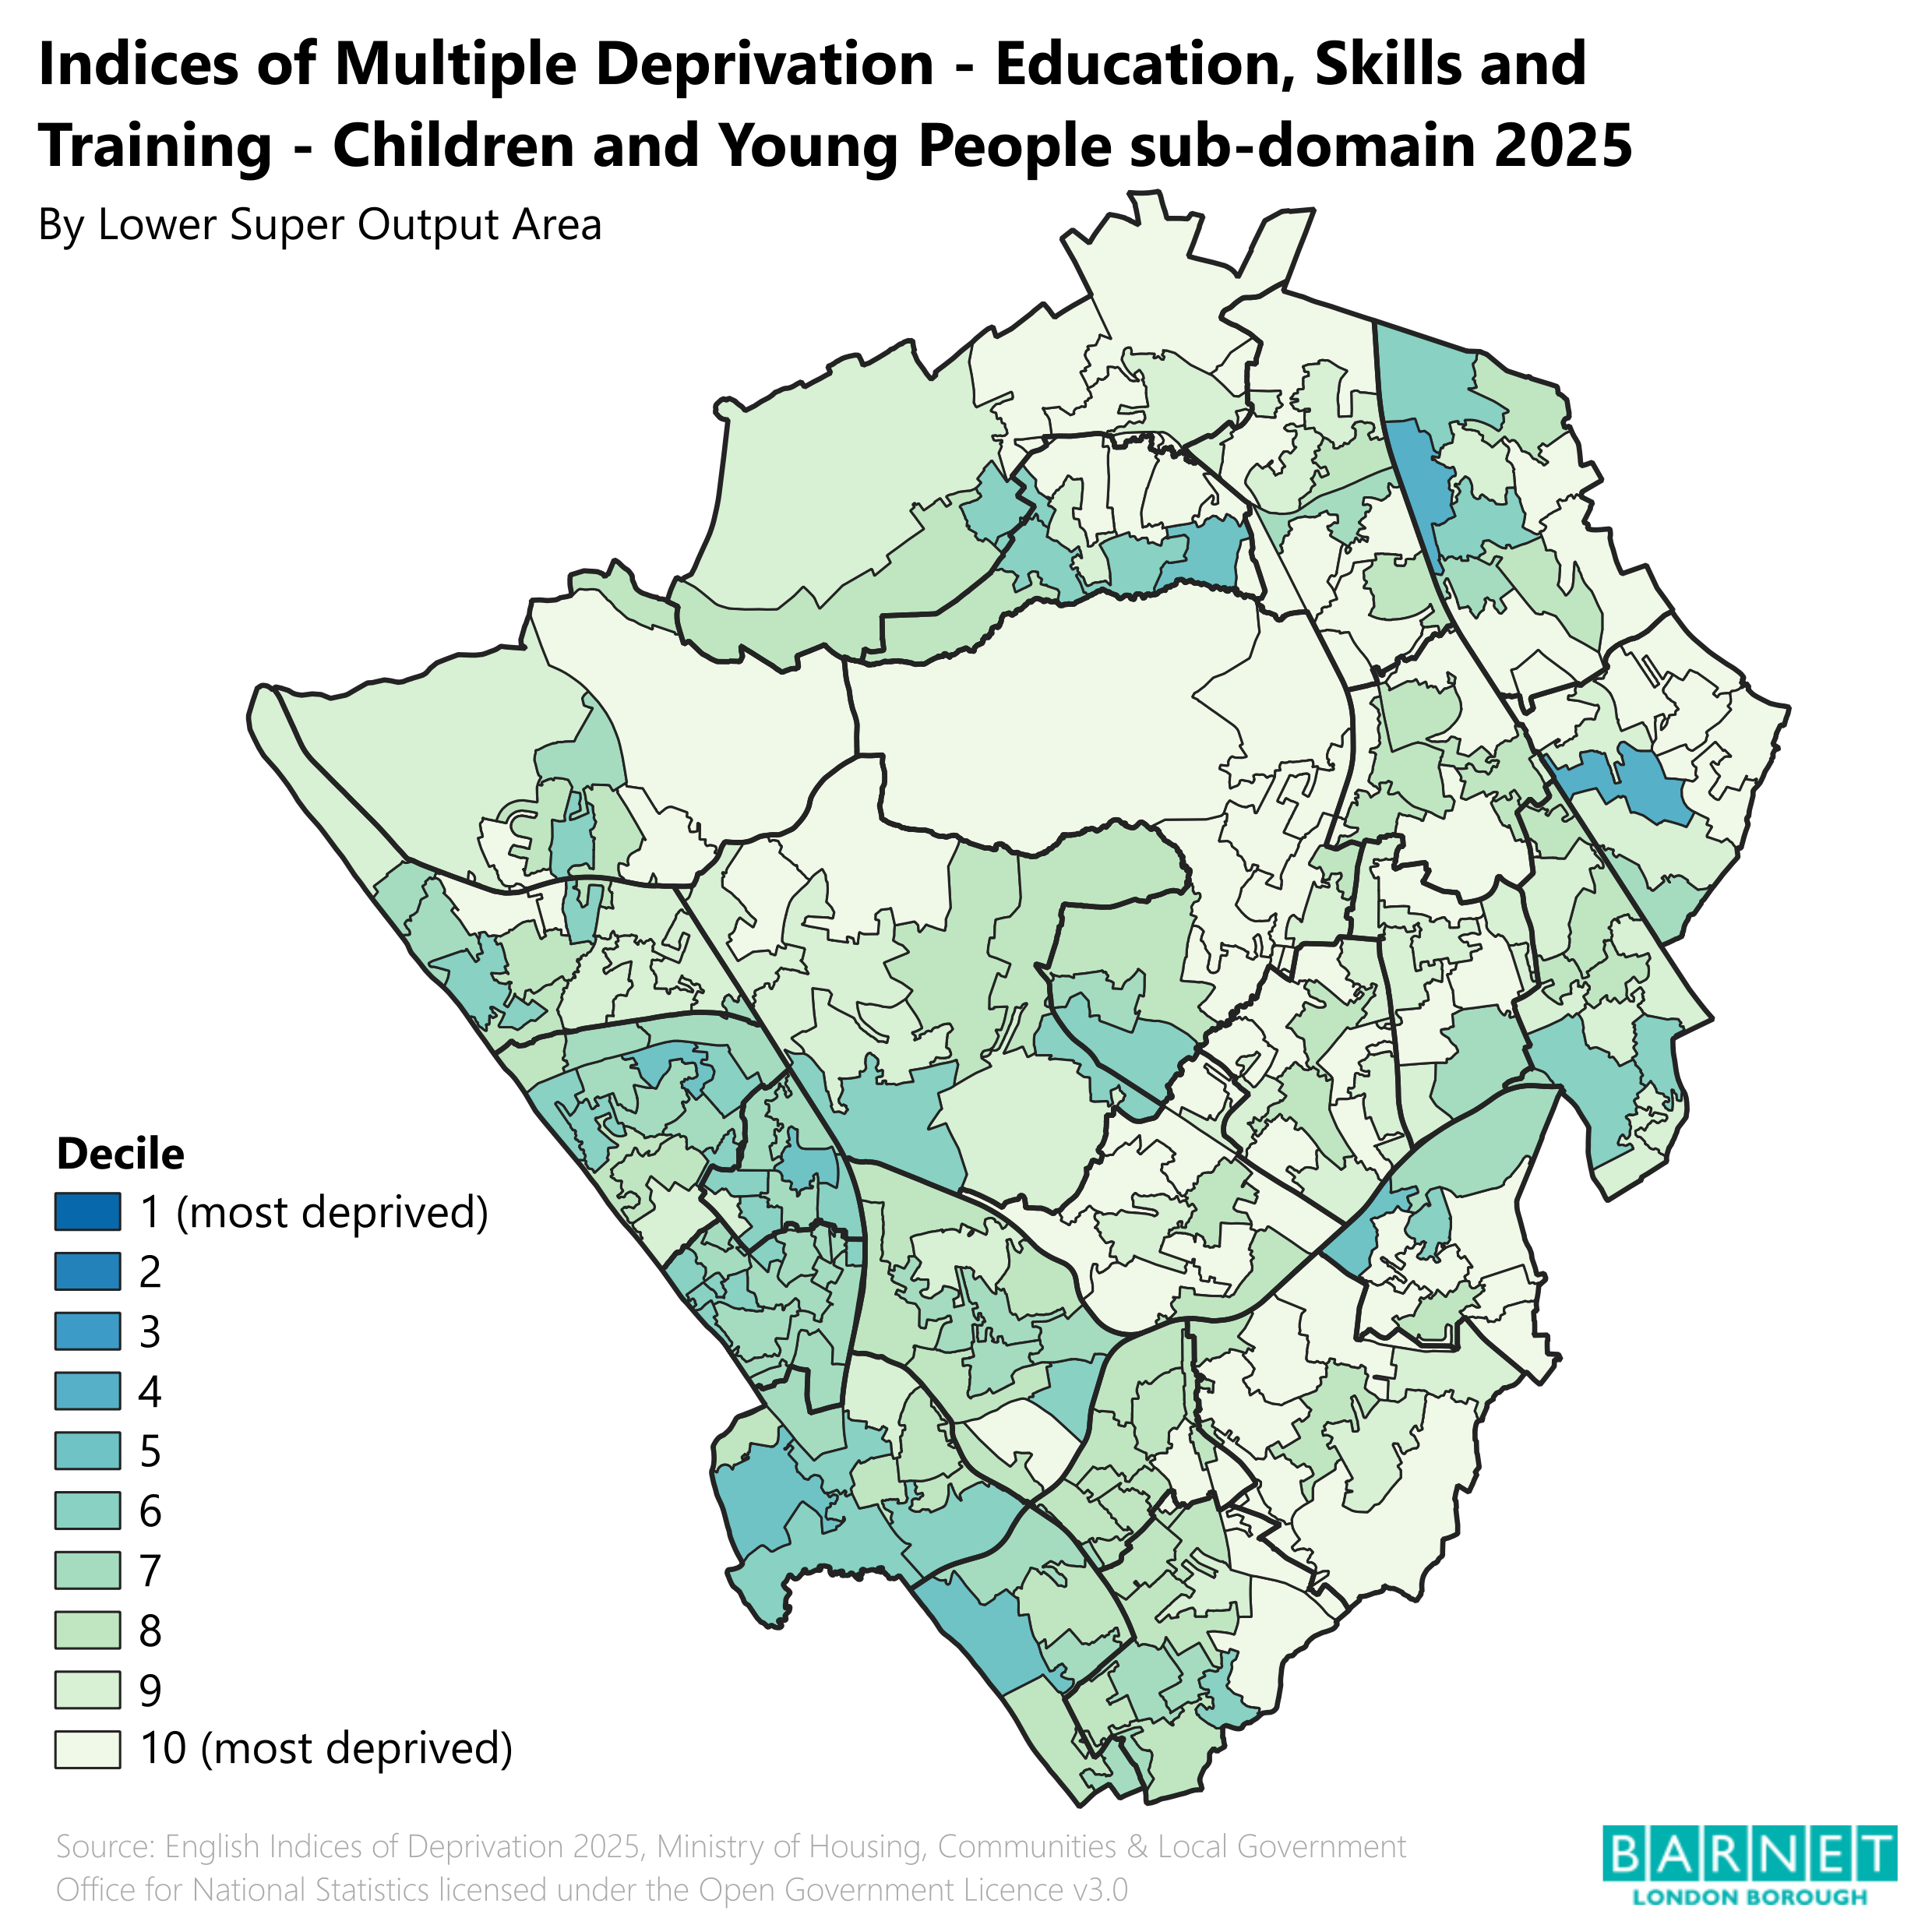
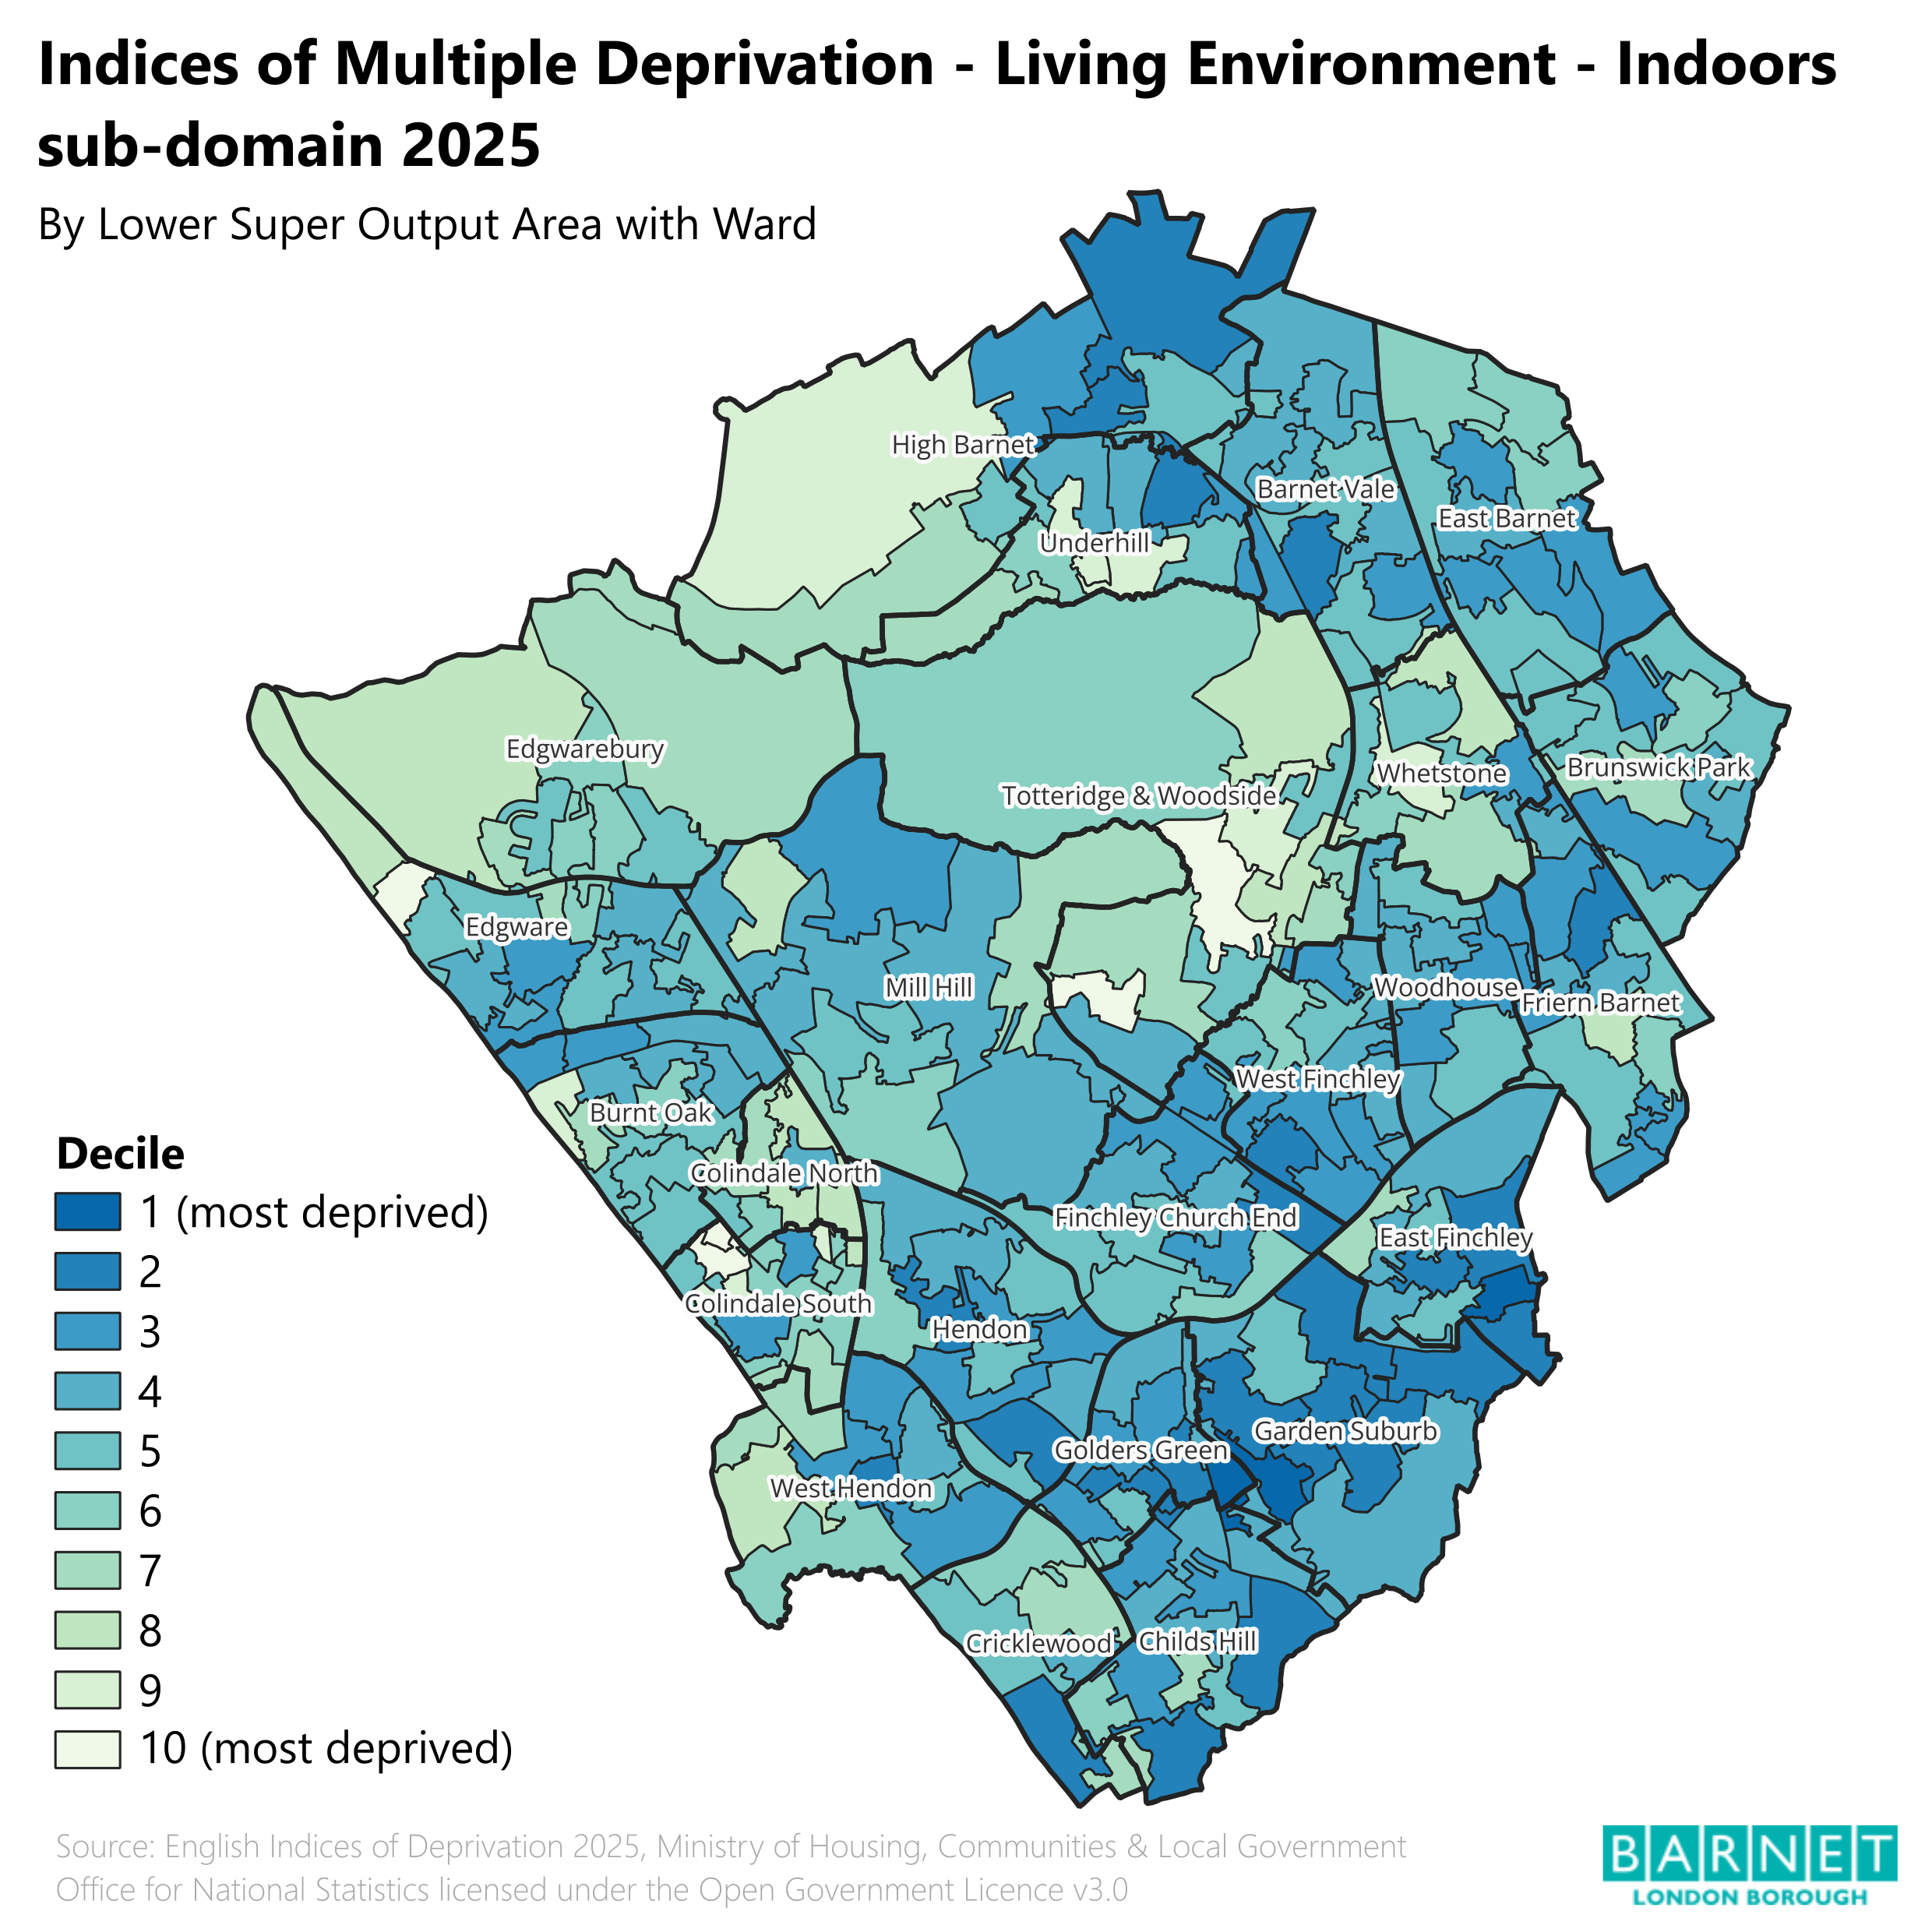
Maps showing the sub-domains of deprivation:
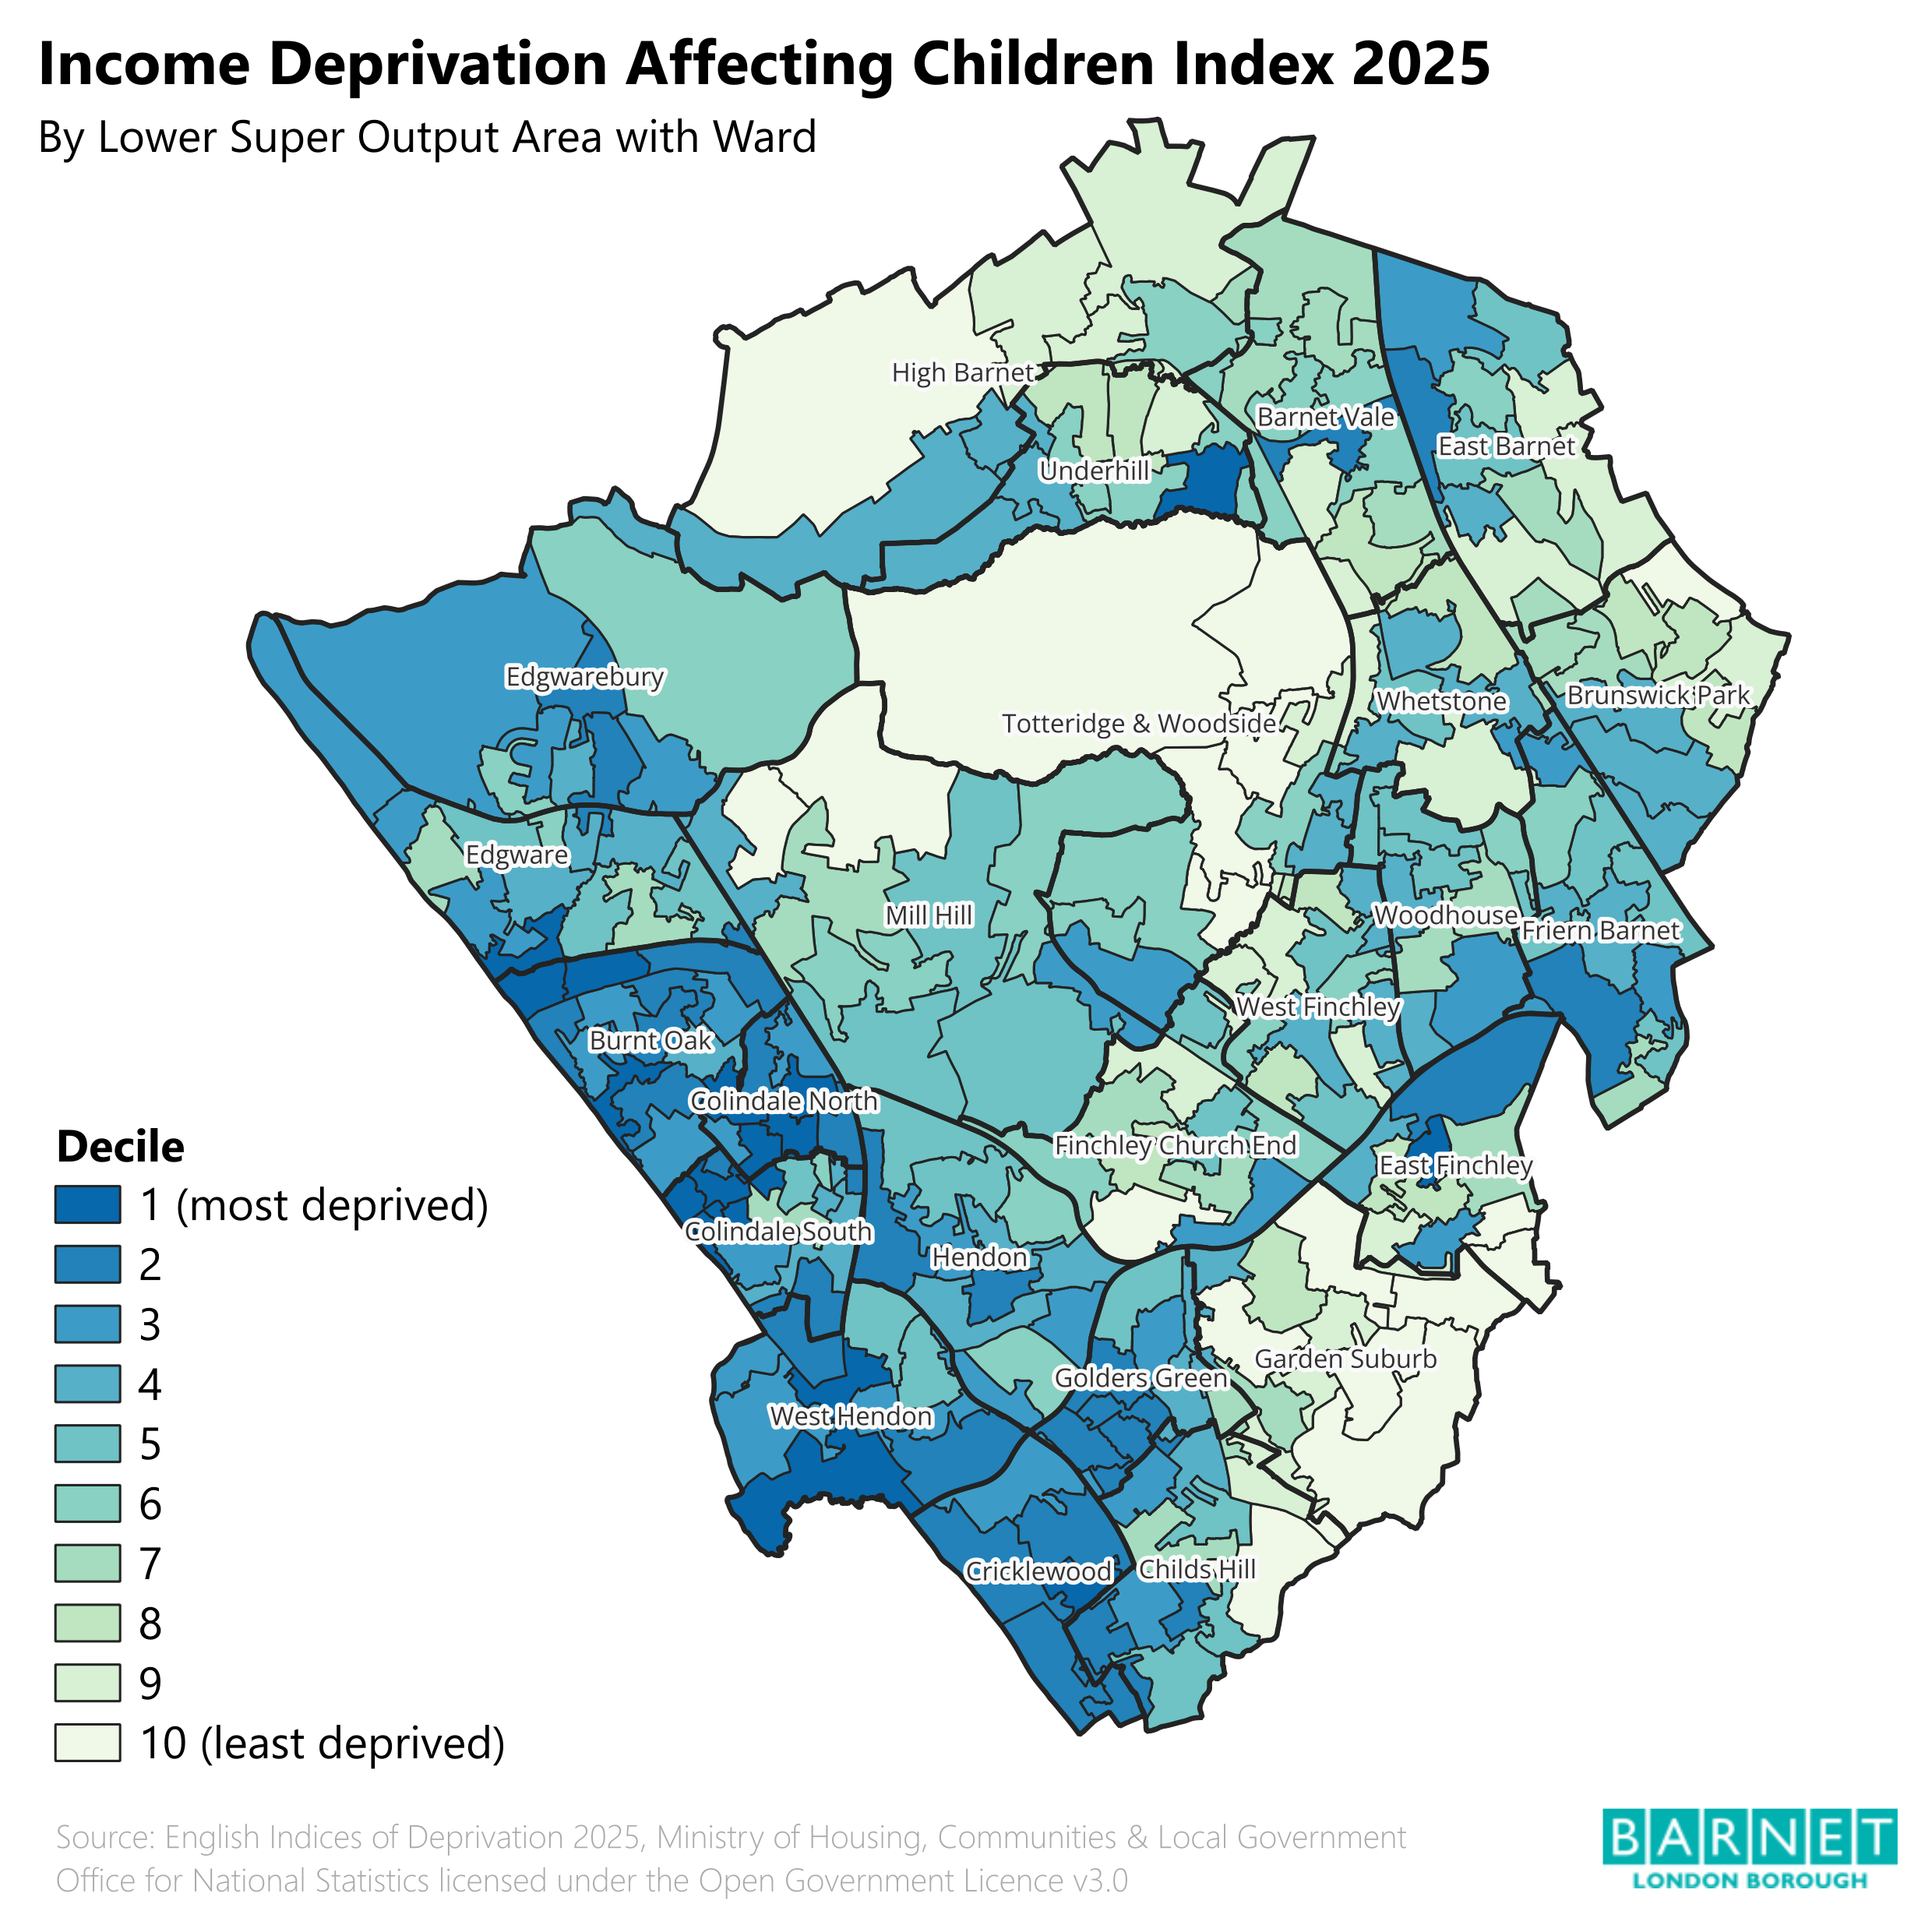
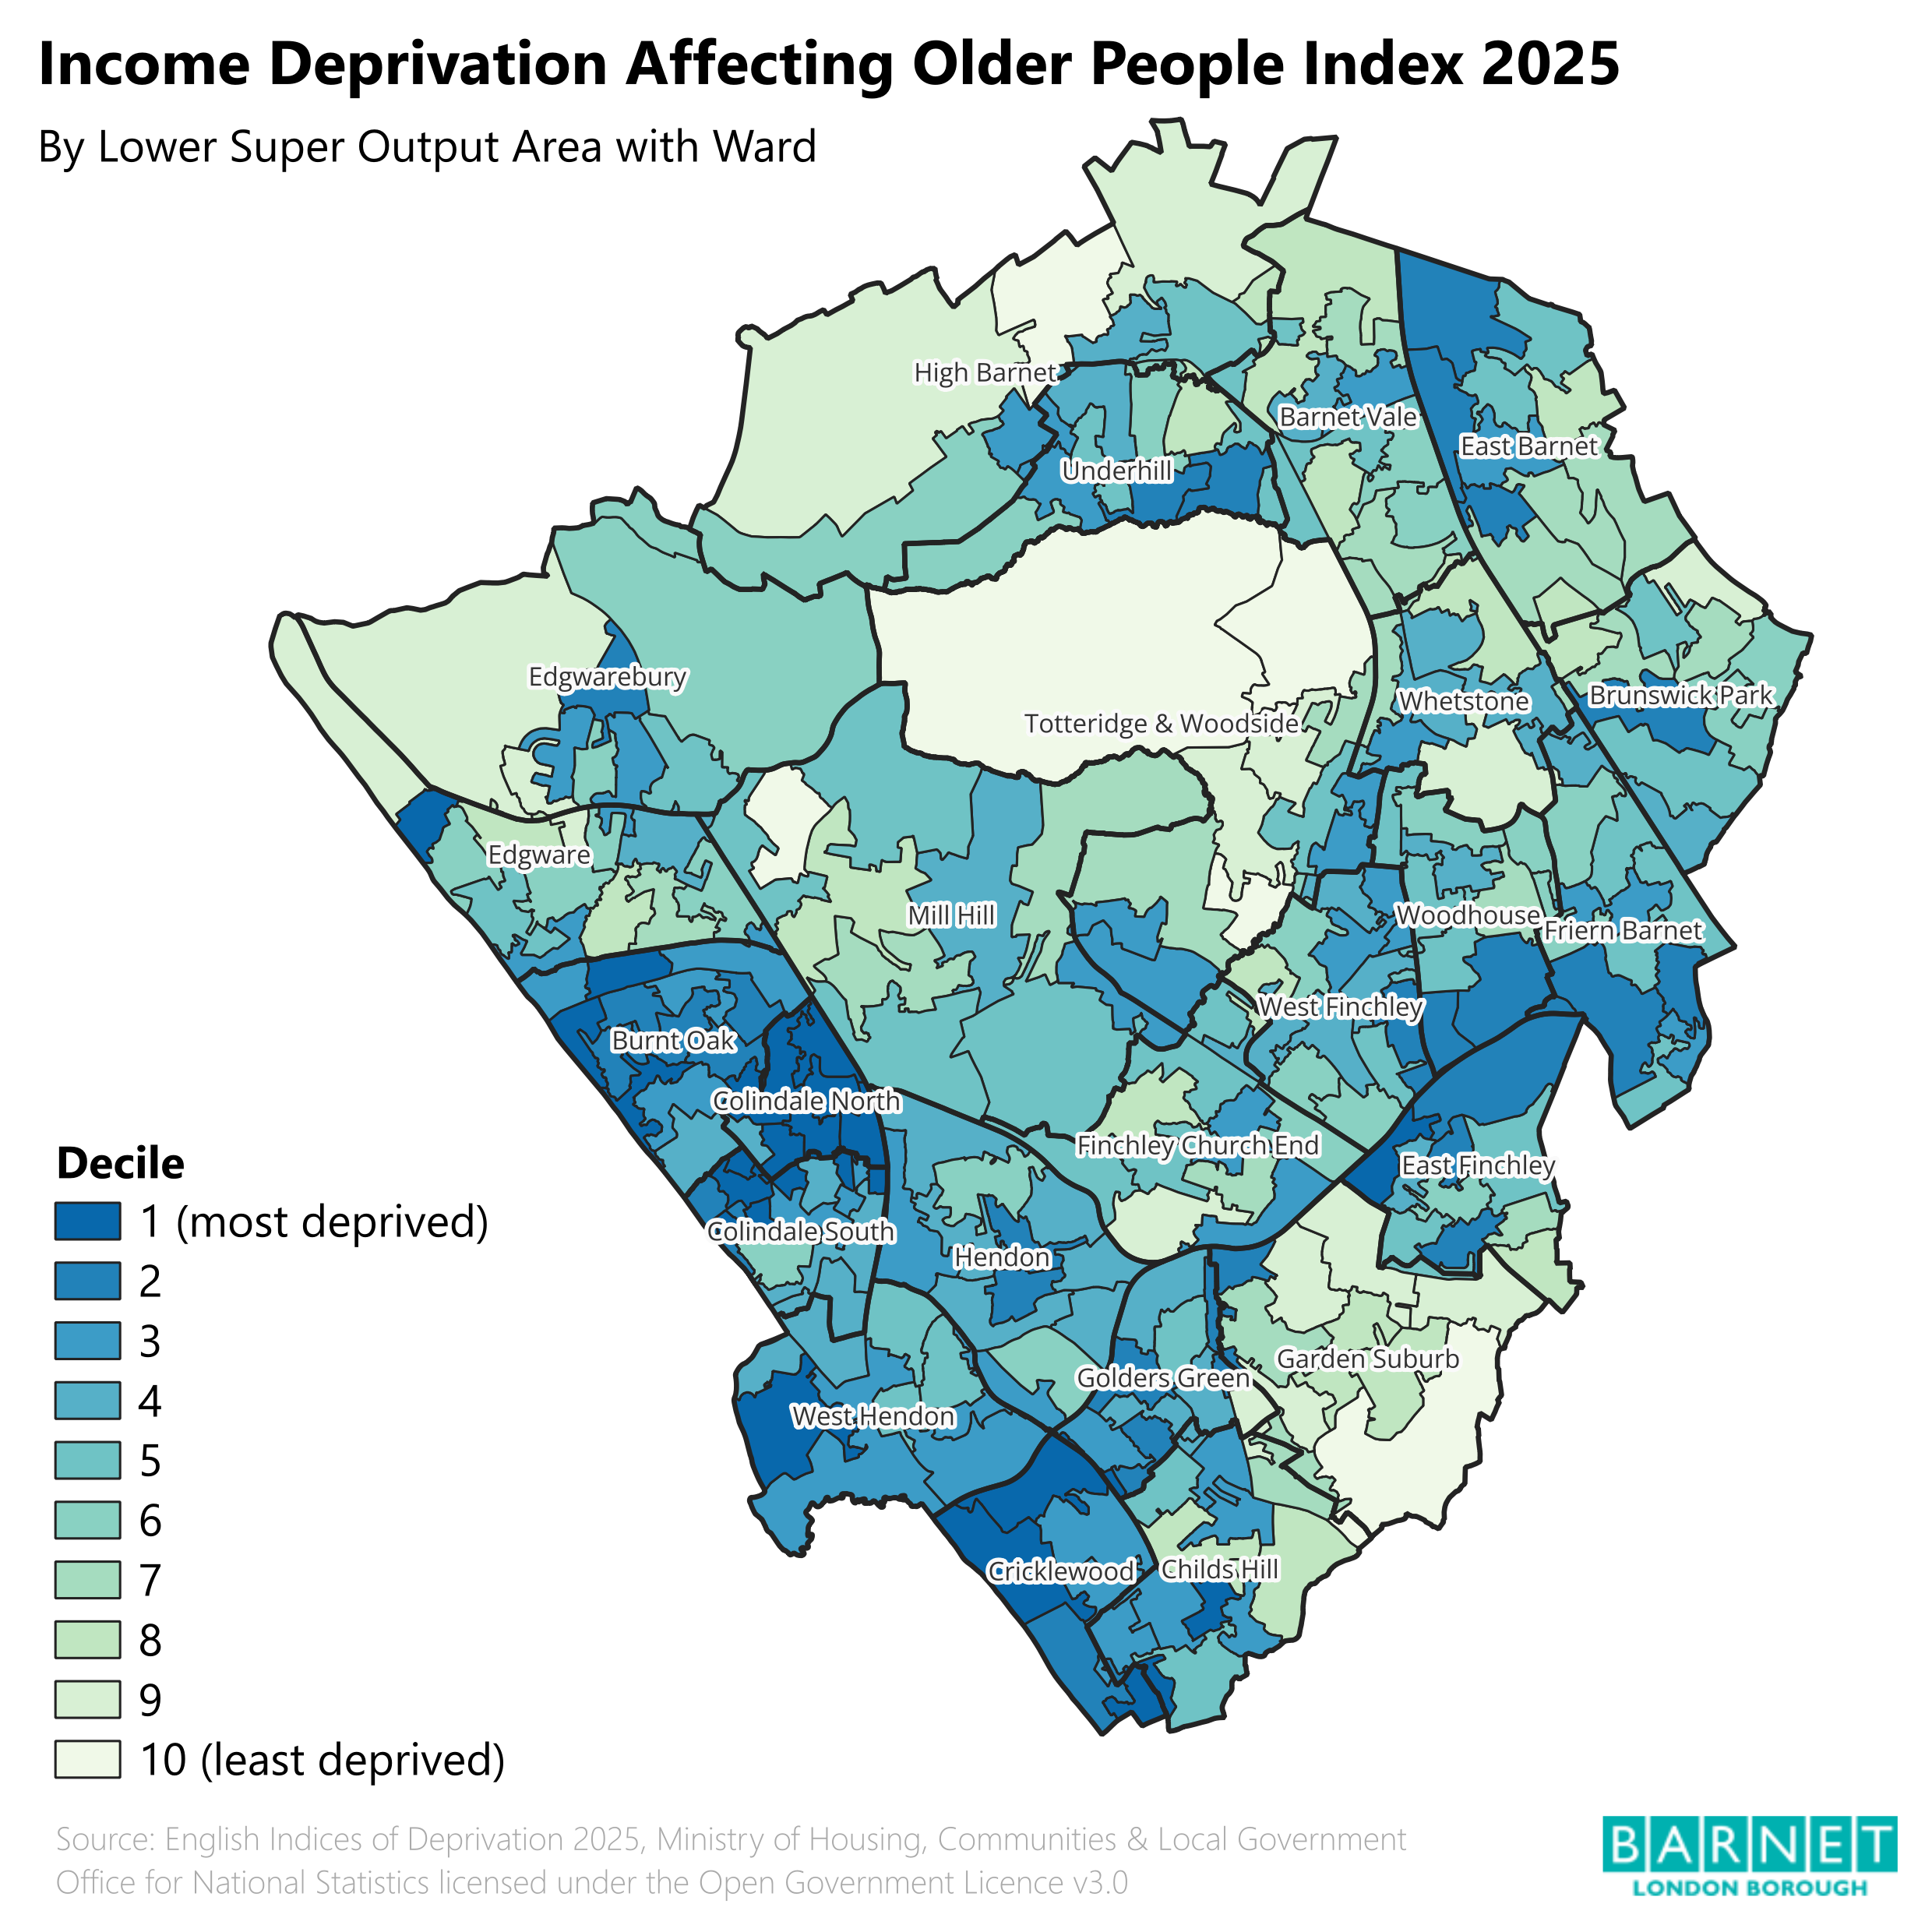
Maps showing the supplementary indices of income deprivation in children (IDACI) and in older people (IDAOPI):
Electoral ward-level data
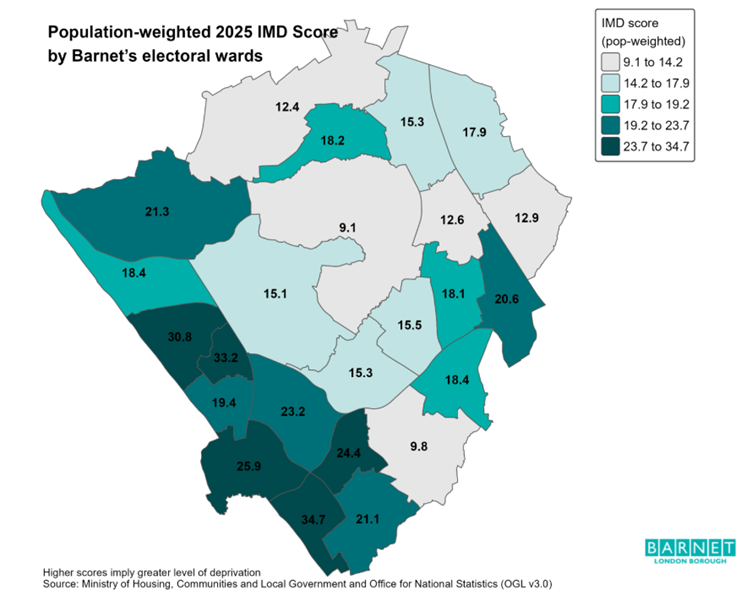
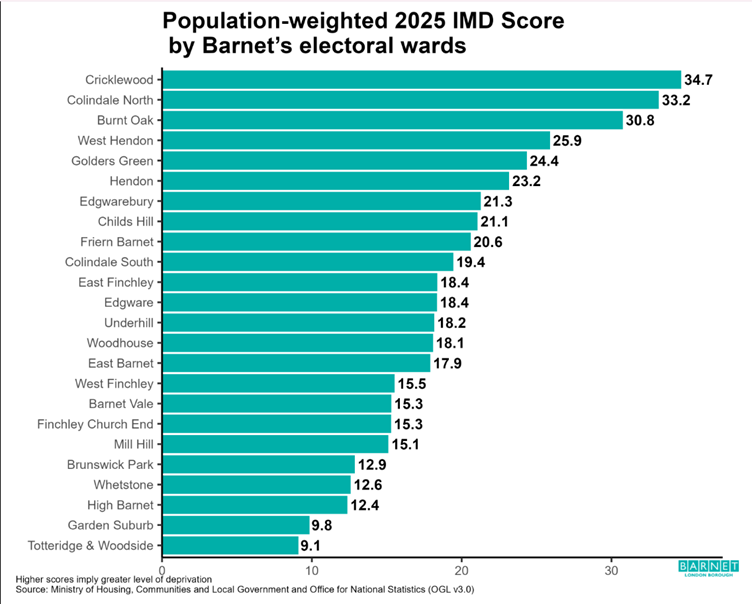
Best-fit method: MHCLG does not publish IMD scores directly for electoral wards and so these must be calculated. Ward boundaries and LSOA boundaries do not perfectly align – a single ward may include parts of several LSOAs, and an individual LSOA may overlap more than one ward. To address this issue, the Office for National Statistics (ONS) uses an established and nationally recognised approach known as the “best‑fit” method.
The best‑fit approach assigns each LSOA to the ward it most closely relates to, based on where most of its population lives. This allows LSOA‑level data to be grouped into wards in a consistent and meaningful way. Once these assignments have been made, deprivation scores for wards can be calculated by combining the IMD scores of the LSOAs assigned to each ward.
Population-weighting: LSOAs vary in both geographic size and population and so to ensure that ward‑level scores accurately reflect the people who live there LSOAs with larger populations have a greater influence on the ward score and LSOAs with smaller populations have a lesser influence. This is achieved by weighting each LSOA’s IMD score according to its population size. The specific population used depends on the purpose of the analysis (for example, total population, children, or older people). In this case, the calculations use the total resident population of Barnet, based on 2022 population estimates.
Caveats: It is important to note several limitations when interpreting IMD scores at the ward level. Because LSOA and ward boundaries do not perfectly align, the resulting ward‑level scores are estimates rather than precise measures. Some local variation and geographic detail are inevitably lost during the aggregation process. The method also relies on population estimates, which are themselves subject to uncertainty. Any inaccuracies in population data may influence the final ward‑level scores, particularly in smaller or more complex areas. Finally, wards often contain areas with very different levels of deprivation. A single average score can therefore mask pockets of high deprivation within wards that otherwise appear less deprived overall.
Do you have feedback about the JSNA? A feedback form can be accessed here. Your feedback is valuable to us and we appreciate any comments or suggestions you have about the JSNA.