JSNA – People – Mortality
Last Updated: June 2026
Mortality
Mortality statistics are a key indicator of public health and quality of life. They help us understand patterns in life expectancy, the leading causes of death, and how these vary across different communities and demographic groups. This page brings together a range of analytical resources focused on mortality in Barnet, offering insight into long‑term trends, local inequalities, and the factors that shape health outcomes across the borough.
Dashboard
The mortality dashboard is an interactive tool, providing detailed insight into mortality and life expectancy within Barnet. This is sorted into themes of standardised mortality ratio, age of mortality, leading and preventable causes of mortality, and life expectancy.
What’s new?
- Updated standardised mortality ratios for 2023
- New mortality data by leading and preventable cause for 2021-23
- Updated life expectancy and healthy life expectancy for 2021-23
Headline Figures
- Life expectancy in Barnet is 81.7 years in men and 85.5 years in women (2021-2023).
- As of 2023, the standardised mortality ratio in Barnet is 626 in women and 872 in men. This has been declining since 2020. The standardised mortality ratio differs within the borough; it is highest in Coppetts and lowest in Garden Suburb.
- The largest amount of deaths occurs in those aged 85 years and over, with mortality in this group representing 45.3% of all deaths in 2020.
- Cancer is the leading cause of mortality in Barnet – the current cancer mortality rate is 237 per 100,000 in men and 180 per 100,000 in women. This rate varies by ward and is highest in Burnt Oak and lowest in Finchley Church End.
- The standardised mortality rate of causes considered preventable in those aged 75 years and lower is 77.6 in females and 158.4 in males – in both genders, this is below the London and England averages. The highest preventable cause of death is cancer in women, and cancer and cardiovascular disease in men.
Dashboard Narrative
Standardised Mortality Ratio: Standardised mortality ratio (SMR) is the ratio of the number of deaths in a population in a time period to the number that would be expected over the same period if the population had the same age-specific rates as a standard population. The SMR varies by sex in Barnet, with a ratio of 626 in women compared to one of 872 in men in 2023. These ratios are both significantly below the London and England averages. At the ward level in 2016-2020, SMR is highest in Coppetts, with a ratio of 114; meanwhile the lowest SMR was observed in Garden Suburb at 53.
Children: There are several different measures of mortality in children: neonatal mortality ratio (number of deaths under 28 days per 1,000 live births), infant mortality rate (number of deaths in persons aged under 1 year per 1,000 live births), and child mortality rate (number of deaths due to all causes in persons aged 1-17 years per 100,000 population). The neonatal mortality ratio, infant mortality rate, and child mortality rate in Barnet are all similar to the London and England averages in 2021-23.
Age: The percentage of deaths by age group has remained stable over time in Barnet. 45% of deaths occur in those aged 85+ years – this is higher than the London and England average, most likely due to Barnet’s aging population. The winter mortality index measures the difference in mortality in those aged 85+ in the winter months compared to the summer. As an impact of the COVID-19 pandemic, the winter mortality ratio in Barnet rose by over 600% in August 2020 – July 2021. However, it has since decreased once more to 6.3 percentage difference in Aug 2021 – July 2022. This is the lowest the index has ever been, and is in line with the regional and national average.
Leading causes: The leading cause of mortality in Barnet in 2021-23 was cancer, with a mortality rate of 203 per 100,000 – cancer is the leading cause of mortality across London and England as well. Mortality from cancer was higher in men than in women. In 2021-23 the second highest cause of mortality was heart disease, with a rate of 81 per 100,000 – mortality were again higher in men. The rate of leading causes of mortality vary on a ward-level, with Burnt Oak having the highest mortality rate from cancer, respiratory disease, coronary heart disease, and stroke in 2016-2020.
Preventable causes: In Barnet in 2021-23, the SMR from causes considered preventable was 77.6 in females and 158.4 in males – in both genders, this is below the London and England averages. The preventable mortality rate in both genders peaked in 2020-22, a clear impact of the COVID-19 pandemic. For women, the highest preventable cause was cancer with a rate of 27 per 100,000. In men, the cancer (45 per 100,000) and cardiovascular disease (35 per 100,000) were the top preventable causes.
Life expectancy: In 2021-23, the life expectancy in Barnet was 81.7 years in men and 85.5 years in females. General life expectancy varies at the ward level and in 2016-2020 was highest in Garden Suburb (88.2 years) and lowest in Burnt Oak (80.1 years). Healthy life expectancy as of 2021-23 was 65.0 years in men and 64.6 years in women in Barnet.
Mortality and deprivation map
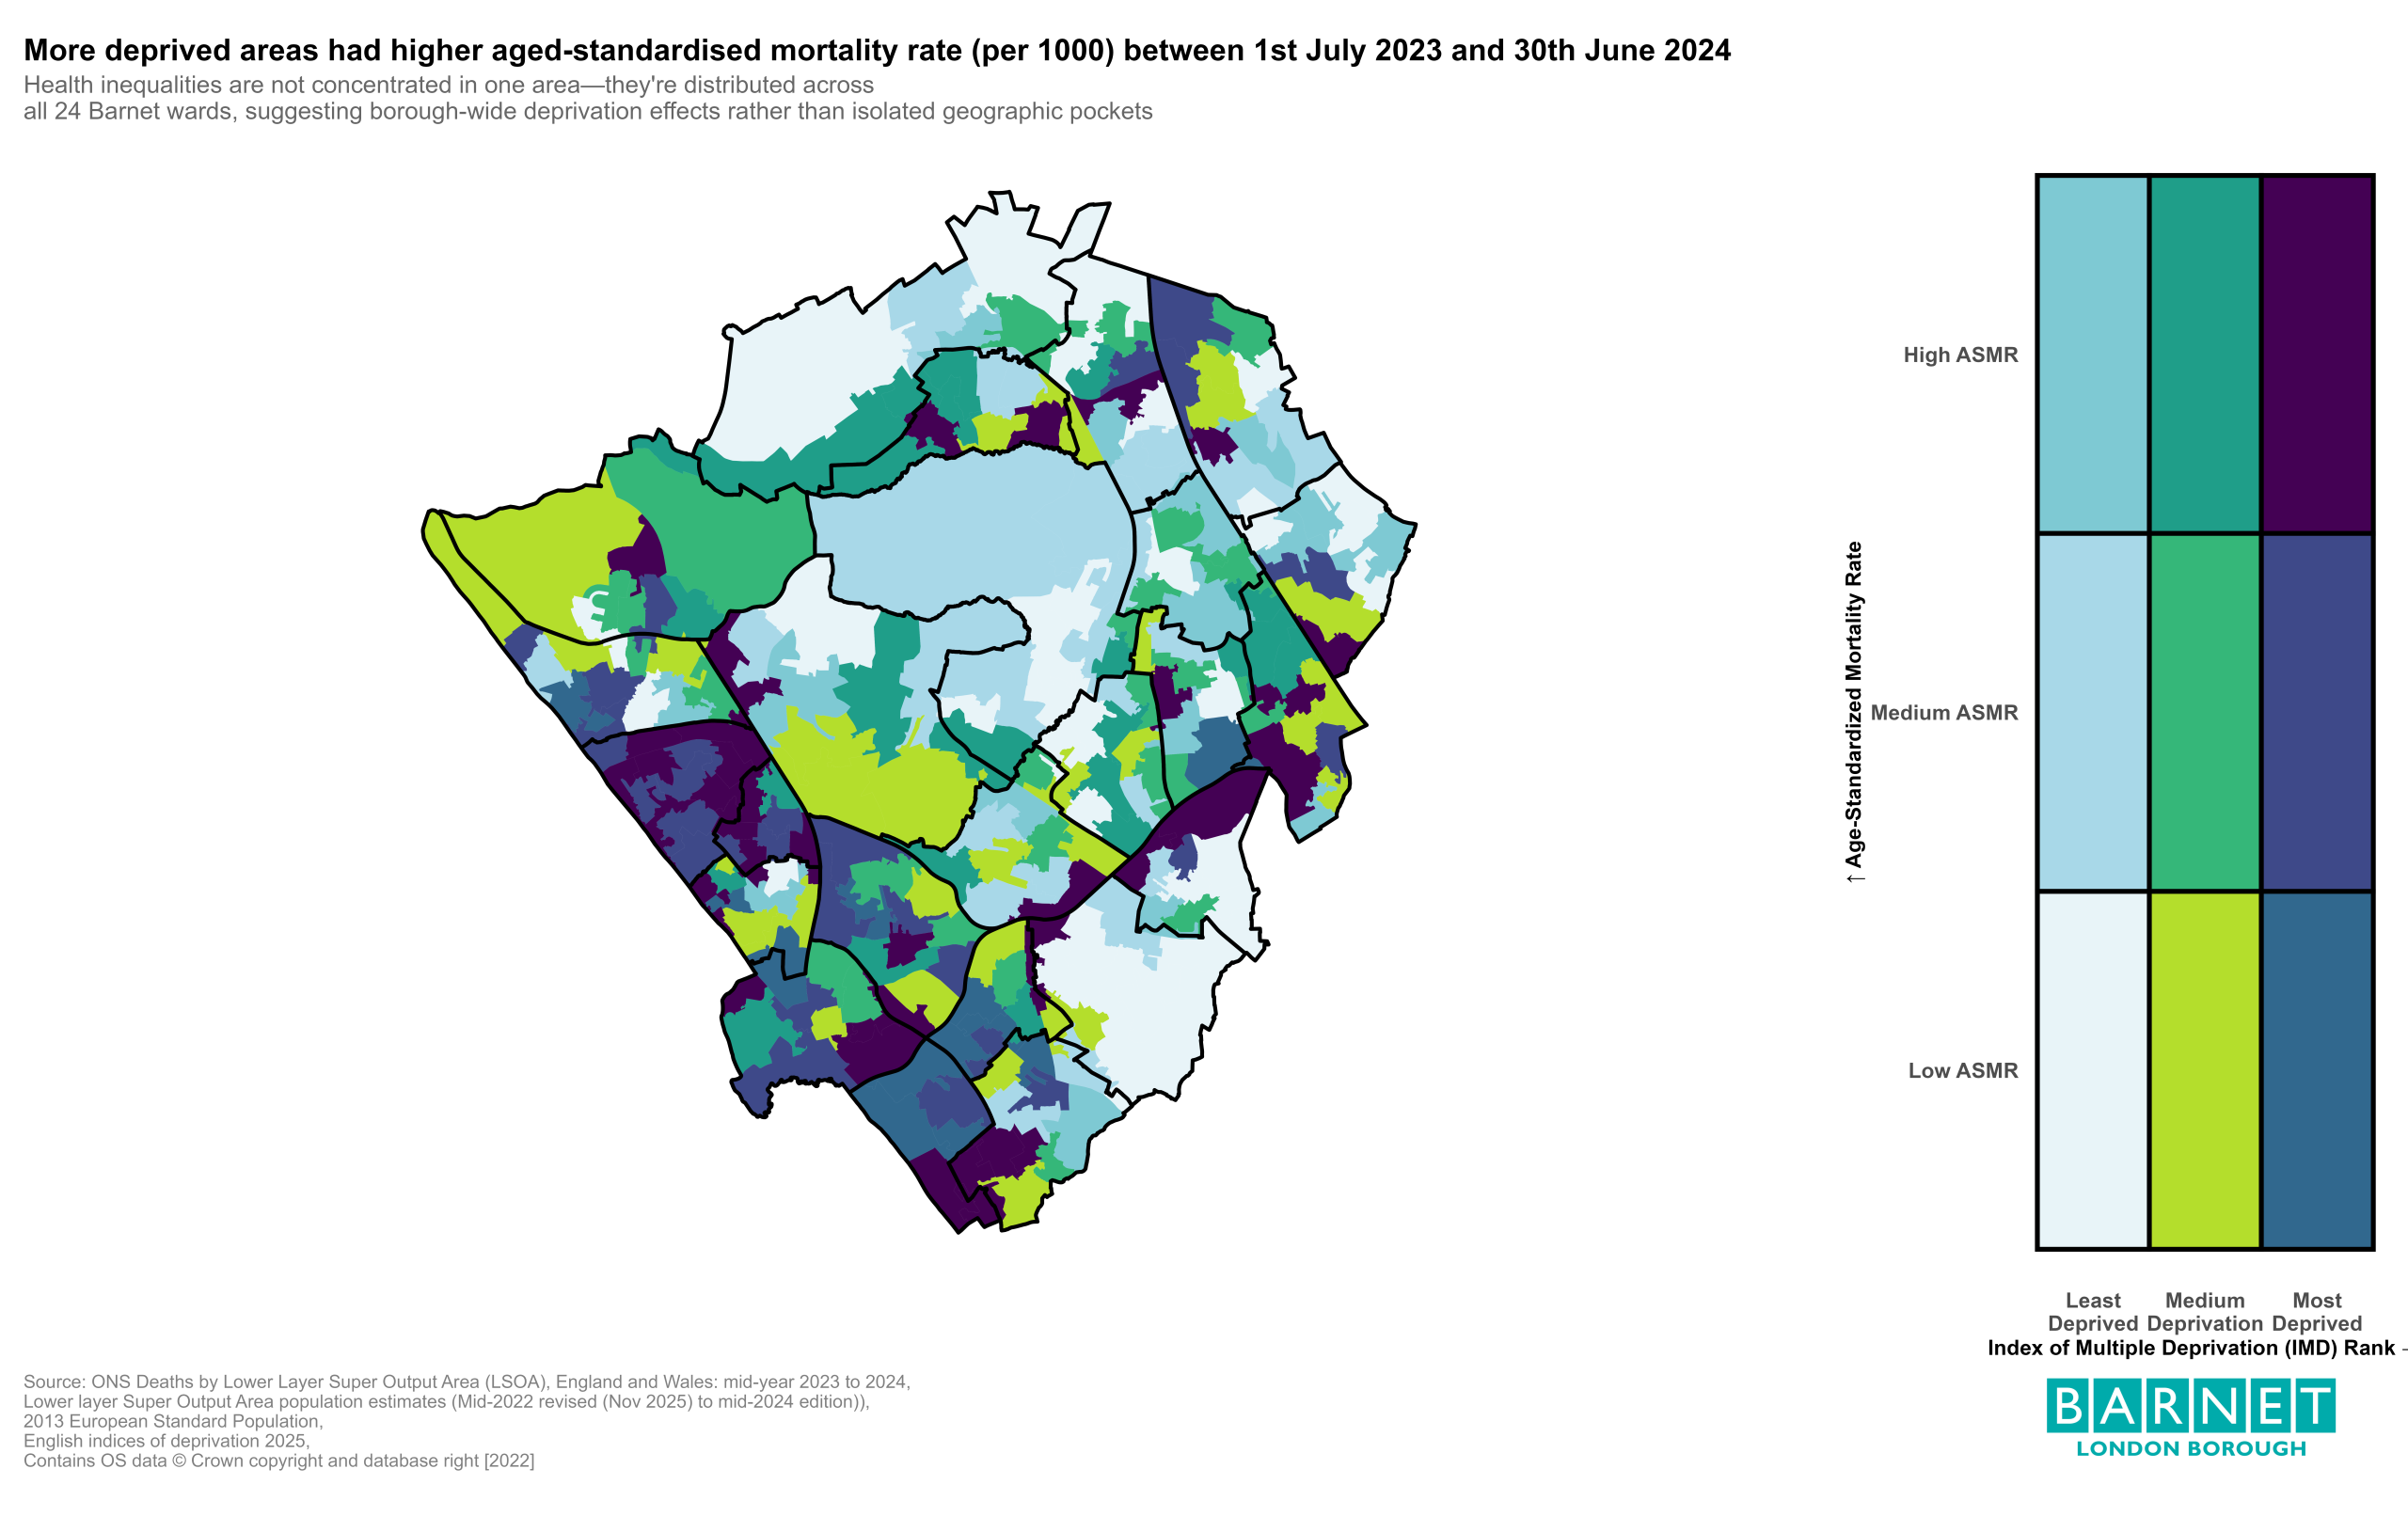
This map highlights a clear link between deprivation and mortality in Barnet. More deprived areas experience higher mortality rates, even after adjusting for age. Key findings include:
- Areas in the most deprived tertile with high mortality have the highest age‑standardised mortality rates (around 10.5 per 1,000).
- In contrast, areas with low deprivation and low mortality have rates closer to 2.3 per 1,000.
- A strong gradient is visible — mortality increases consistently as deprivation increases.
- These inequalities are not limited to one neighbourhood. Higher mortality rates appear across all 24 wards, showing that this pattern is borough‑wide rather than confined to isolated pockets
Further information
- OHID Mortality Profile: bring together a selection of mortality indicators to provide a wide range of publicly available resources and make it easier to assess outcomes across a range of causes of death.
- OHID Productive Healthy Ageing Profile: provide data and further information on a wide range of topics relevant to our health as we age.
- North Central London Child Death Overview Panel (CDOP) Annual Report 2024/25: part of CDOP’s work to identify every opportunity to learn and to recommend improvement that might prevent another child death in the future.
Do you have feedback about the JSNA? A feedback form can be accessed here. Your feedback is valuable to us and we appreciate any comments or suggestions you have about the JSNA.