JSNA – People
ARCHIVED PAGE
To access the most recent JSNA please click here.
About the Borough:
This section of the JSNA provides information on the population and key statistics about Barnet and the people who live in the Borough. In the following we explain the indicators shown later in the interactive element of this section. Following the interactive pages, we highlight the key messages from the indicators. The indicators in this section are:
- Population
- Life Expectancy
- Healthy Life Expectancy
- Fertility Rate
- Employment
Population:
Understanding population composition in terms of age, gender and ethnicity is vital to the effective planning of services and planning for future infrastructure needs such as housing, schools, healthcare facilities and transport.
Key Population Statistics:
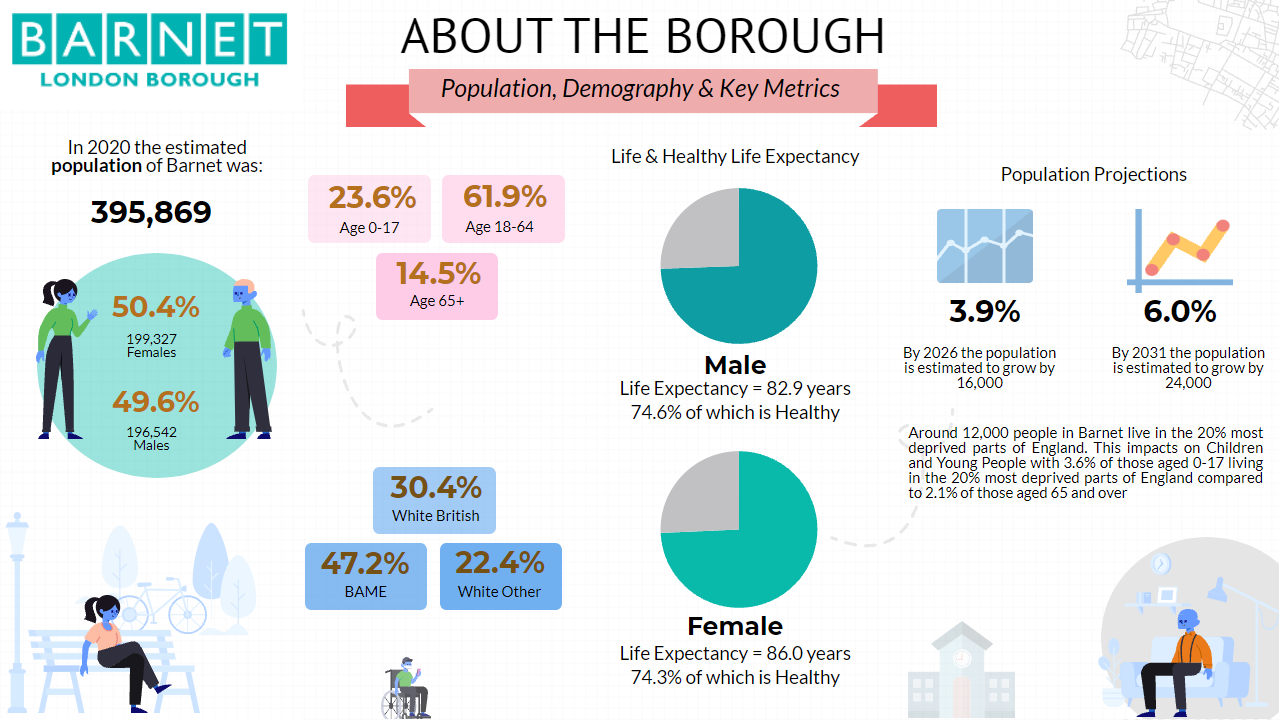
As of 2019, Barnet’s population was estimated to be approximately 396, 000 with around 49% males and 51% female and is represented by three parliamentary constituencies (Chipping Barnet, Finchley and Golders Green, and Hendon).
Within Barnet there is considerable variation in the size of wards, with population ranges from approximately 16,300 to around 26,200. Colindale being the most populous and accounting for approximately 8% of the Borough’s total population. This will change next year as ward boundaries are changing following a review of the existing ward boundaries.
The population of Barnet is has a similar proportion of the population aged 60 and over to the London average. Compared to England, the Barnet population is generally greater in the ages 0 to 49.
Around 12,000 Barnet residents (primarily in the wards of Brunswick Park, Burnt Oak, Colindale, Golders Green and Underhill) live in the 20% most deprived places in England.
The population of Barnet is expected to grow by around 5.2% (20.7 k people) over the next 10 years (2031) and 9.2% (37k people) over the next 20 years (2041). Much of the growth is likely to be those aged 65 and over (16k over the next 10 years and 34k over the next 20 years).
Barnet’s population is diverse, with an overall Black, Asian and Minority Ethnic (BAME) population of 48%. This diversity is more pronounced in children and young people – there are more children from BAME groups in the 0 – 9 age group than there are white children.
Life Expectancy at Birth:
Life Expectancy is the average number of years a person would expect to live based on current mortality rates. For a particular area and time-period, it is an estimate of the average number of years a new-born baby would live if he or she experienced the age-specific mortality rates for that area and time-period throughout their life.
Healthy Life Expectancy at Birth:
Healthy life expectancy is a measure of the average number of years a person would expect to live in good health based on current mortality rates and prevalence of self-reported good health. The prevalence of good health is derived from responses to a survey question on general health. For a particular area and time period, it is an estimate of the average number of years a new-born baby would live in good general health if he or she experienced the age-specific mortality rates and prevalence of good health for that area and time period throughout his or her life.
Key Life Expectancy at Birth Statistics:
Life Expectancy for both males (82.9 years) and females (86 years) in Barnet continues to grow and is significantly higher than the average for England (males 79.8 years and females 83.4 years).
Healthy Life Expectancy for both males (61.8 years) and females (63.9 years) in Barnet has decreased in recent years. For males, it is now lower than the average for London (63.5 years) and England (63.2 years). Healthy Life expectancy for females in Barnet is similar to average in London (64 years) and fractionally higher than the average for England (63.5yrs).
Life Expectancy at Age 65:
Life Expectancy at age 65 is the average number of years a person would expect to live based on contemporary mortality rates. For a particular area and time period, it is an estimate of the average number of years at age 65 a person would go on to live, if he or she experienced the age-specific mortality rates for that area and time period throughout his or her life after that age.
Healthy Life Expectancy at Age 65:
A measure of the average number of years a person aged 65 years would expect to live in good health based on contemporary mortality rates and prevalence of self-reported good health.
Key Life Expectancy Statistics:
Life Expectancy at age 65 for both males and females in Barnet continues to grow and is significantly higher than the average for England.
In Barnet for males the trend in healthy life expectancy at age 65 has been increasing while for females it has been decreasing. For both genders it is higher than the average in England but not significantly so.
Fertility Rate:
The fertility rate is the ratio of the number of live births to the number of women aged between 15 and 44. Fertility rates are closely connected to growth rates for an area and can be an excellent indicator of future population growth or decline in that area
Key Fertility Statistics:
The fertility rate in Barnet has been falling for the last few years following a period of stable rates between 2010 and 2016. Fertility rates in Barnet are higher than those in England and London.
The changing fertility rate is reflected in the Borough’s population of under 0- 17 year olds predicted to decrease by 7k over the next 20 years.
Unemployment:
The below notes the total number and percentage of claimants of Out of Work Benefits and Universal Credit depending on the time period selected and what wards in Barnet have the highest number of claimants.
Key Unemployment information:
Following a period of employment growth and low unemployment, since March 2020 employment has been decreasing and unemployment increasing across the country. Out of Work Benefits (Job Seekers Allowance) and Universal Credit have seen an increase due to the pandemic’s impact on job security.
Text Last Updated: 29.06.21